I'm working with Plone 4.0 on Ubuntu. (I know I should upgrade, but I'm working towards that...)
So I have a plone site that I have put onto a development server. I haven't set up reverse proxy with nginx yet. I am just using it as a test for now, so I don't need to do that yet. I start the server, pretty much like it is described in here https://docs.plone.org/4/en/manage/deploying/production/ubuntu_production.html
Now it works fine, so I stop the server and put in my own blobstorage and Data.fs files. This is a site that's been running on a different server under the same version of Plone. I start up the server and it works great.
However, when it first starts up, and I go to it in my browser, it takes maybe 2-3 minutes before responding.. I figured that's just the server starting up. Then I navigate around the site and it's fine, it's fast as any other site.
But if I go away for 5 minutes and come back to it and click another link, again it takes 2-3 minutes of spinning before responding with the page. If I click again on another page, then it is back to normal response times again.
It's like it went to sleep or something when I went away and had to wake up or something. (that's just the feeling I get). I tried it with the default install (blank new Plone site) and it was fine, it did not have this delay problem.
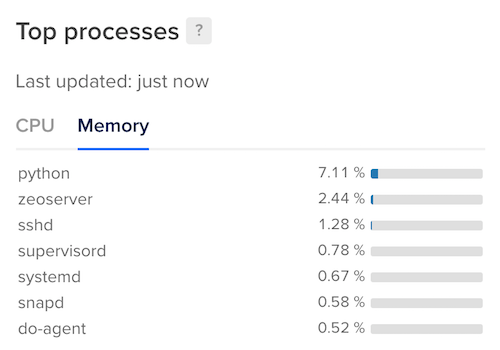
OK I ran top but I'm not sure what I'm supposed to be looking for.
When I reproduce the problem by accessing my site after a delay, top looks fine... I think the top item was python briefly at 7%, then it drops off and other things take over at 0.3% of the memory etc. The site still doesn't load for another 2 minutes or so... when it finally loads python goes back on top briefly at like 7% then falls off.
Again, I'm not really sure what I'm supposed to be looking for. Nothing seems to be taking up too much memory to me?
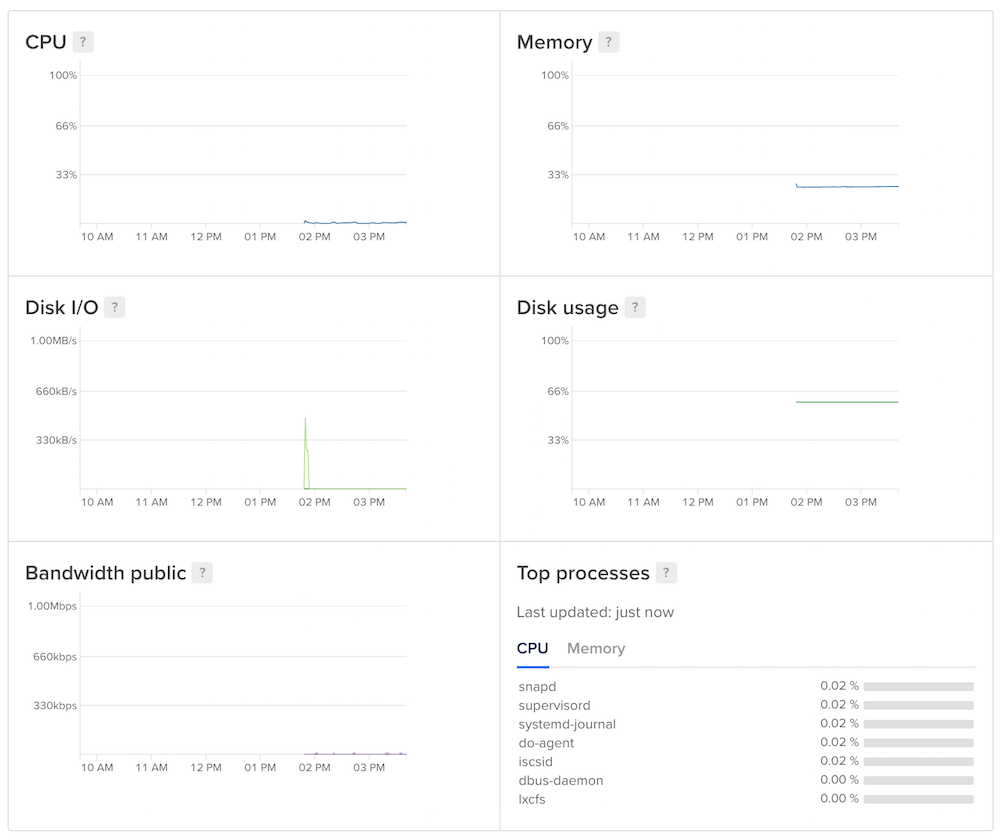
Is that good or bad? When I look at the performance, it looks fine:
This graph is from DigitalOcean and it covers the time when I accessed the site and it had a long wait time, as well as when I accessed it and it came back quickly... the memory usage seems to be a straight line... do you think I need to do anything different memory-wise?
My suspicion is that your zodb-cache-size is set far too low. If it takes 2-3 minutes to load the first page, you probably need a lot of zodb objects for the initial rendering. You're staying fast while the operating system is keeping those in its cache, but when things are quiet that cache if getting de-allocated or is used for other file system items.