Plone.recipe.zope2instance - memory usage

I have two instances on my buildout.cfg
They both have these declared:

[instance]
<= client_base
.# <= instance_base
recipe = plone.recipe.zope2instance
zserver-threads = 4
zodb-cache-size = 30000
zeo-client-cache-size = 256MB
zeo-client-blob-cache-size = 1GB
.## Zeo server
zeo-address = ${zeo:zeo-address}
http-address = 8080

What could be the reason that each of these processes on my Ubuntu are eating up 40% of memory.

My server has 16GB RAM which means 80% of it is already gone - due to such situation a lot of swapping of memory is being taken place... and system is producing slow performance.
CPUs are not burdened up at all.

The cache is per thread, this already potentially quadruples your per instance memory footprint there.

An another issue is the size accounting is rumoured to be not very accurate for ZODB. Can anyone shed any light on the current state of affairs there?

Drop the size based cache declarations, use one thread per instance and muck around with the object count cache size to your provisioning liking.

zeo-client-cache-size and zeo-client-cache-size are about disk space and not memory related.

as @Rotonen mentioned, the zodb-cache-size directive is per-thread so you have 120.000 objects in your cache for each instance and that could be a waste of memory space if so many threads are not really needed. on the other side you don't mention for how long your instances have been running.

do you really need 8 threads? are you restarting your instances? I don't know.

my recommendation, read this and decide by yourself after that:

1 Like

Thanks both for your input & the useful blog post.

However the question was not about finding the recommended or the right configuration for instances & threads but it was about the unexpected or strange behavior of the memory hikes.

64 bit binary instances:
150MB base + 30,000 items * 4 threads * 12kb ~= 1.5GB

But the memory consumed by my instances is 6GB each. Why?

  • We restarting the OS itself every midnight.
  • When we start our instances (plonectl start) - within 2 to 5 minutes these two instances take up 1.6GB each.
  • We reach 6GB each process memory stage within 1 to 2 hours.

So "zeo-client-cache-size, zeo-client-blob-cache-size" are not affecting the memory/RAM and as such not related.

  • Our traffic patterns seems to be hitting ZODB via zeoserver frequently.
    For the rest, Varnish takes up the load.

An another issue is the size accounting is rumoured to be not very accurate for ZODB. Can anyone shed any light on the current state of affairs there?

Here it seems they are inaccurate and hence misleading.

I will convert (not now) my setup to more instances and 2 threads per instance; but how shall I expect that it wont be hiking the memory or will it stop automatically not hiking memory per instance for example less than 1 gig.
Remember I have 1 virtual server with 16GB RAM and 6 vCPUs with SSD disk.

It's 30000 * threads * object size. Where object size depends on your DB. So you need to judge by your application. For example the autogenerated images scales for plone images are NOT stored in blobs so will be in the ZEO cache and will be much larger than 12kb. You might have lots of custom content types that store large amounts of data not in blobs.
In addition, there could be custom code which stores data in thread local caches or module variables.

If it's not obvious that there are large objects in your DB then I'd just reduce your cache size. 30000 is just a recommendation based on an average site with a largish catalog (which is mostly small objects). For you this might not fit. Reduce it to 10k or 5k and see if slows down your requests.
I'd also reduce your threads to 2 per process. If you run one instance per CPU (recommended) thats 12 simultaneous requests which is a lot. Do you actually need this? If your traffic is that high and your site is not very dynamic I recommend using a 5min p.a.caching rule for items and folders which will put more load on varnish and less on plone so you need less instances running.

1 Like

I'm not referring to this. What you're having is variable object size and you just drop the LRU out of the cache when you hit the count.

I'm talking of cache_size_bytes. While this might still count wrong, it might fit your assumptions better than the object count based caching strategy.

As far as I know there is no other way to provision ZODB memory usage than to just play with the configuration a bit and see where it settles and stabilizes to.

I also recommend running with only one thread per instance and scaling concurrency by spawning more instances. This will have three benefits from my point of view:

  1. Caching is easier to plan for
  2. Your OS has an easier time figuring out its process scheduling
  3. Request handling is not blocked by the Python GIL
1 Like

as @djay mentioned you are incorrectly assuming your object size is 12KB; my recommendation, nevertheless, is going the other way around: increase you cache size. why? let me explain.

if your cache size is too low, the Zope instances will continually discard objects in the cache in order to load new ones from the ZODB and this will lead to memory fragmentation. in my experience, memory consumption grown more rapidly with instances running with a lower number of objects in cache.

what size should you use? according to Hanno Schlichting, a "good" number for the ZODB cache size on Plone context could be around catalog size + 5.000 objects.

for what you're describing I can bet on the first 5 minutes your cache is being completely discarded in order to respond all request coming to the instance and that's why you're seen that huge increase. check the Recent Database Activity on your instance to see if there are many objects loads.

here you have a couple of examples from sites we hosts:

both have a configuration with 2 threads and 80.000 objects in cache; the first one is configured to be restarted after memory consumption hits 3GB; the second, after 2GB.

the first site is a news site with around 75.000 objects in the database; the second, a blog with 89.000 objects in the database. the fist site has a lot more access from robots and use a bunch of functions cached in memory (this also consumes memory and I want to talk about it on a different post one of this days).

instance restarts happen around twice a day on the first one, and once every two days on the second.

so, as you can see, memory consumption really depends on many factors.

read the blog post I mentioned above to debunk the benefits you mentioned here; I was thinking exactly the way you do before I made a lot of tests.

Thanks for useful inputs.

My two instances are configured like this:

[instance]
<= client_base
.#<= instance_base
recipe = plone.recipe.zope2instance
zserver-threads = 4
zodb-cache-size = 20000
zeo-client-cache-size = 256MB
zeo-client-blob-cache-size = 256MB

And the third one:

[instance3]
<= client_base
.#<= instance_base
recipe = plone.recipe.zope2instance
zserver-threads = 1
zodb-cache-size = 2000
zeo-client-cache-size = 128MB
zeo-client-blob-cache-size = 256MB

Parts

parts =
zeo
instance
instance2
instance3
worker (I dont understand its purpose, why)
repozo (I dont understand its purpose, why)
backup (I dont understand its purpose)
zopepy (I dont understand its purpose, why)
unifiedinstaller (I dont understand its purpose)

Third instance has 8 crons configured.
Load balancer is only talking to two instances.
I think I will be configuring all of my instances to restart after every 12 hours instead of 24.

I updated the caching as per this suggestion and after above configuration website performance is increased and memory consumption was better that it reaches 5GB memory after 12 hours or more.
But after two days now, I see that memory is already 4GB in 2-3 hours and after 12 hours it started giving timeouts.

So as I understand I need to play around the settings to find optimal values.

My blobstorage.tgz is 50MB
My Data.fs is 20GB
zodb-cache-size = 10000 - was giving more timeouts
zodb-cache-size = 30000 (and more) - was taking up huge amount of memory and results in memory swaps within 2 hours..

Additional thing is (dev from previous IT company) has setup some of crons to pull data once a day from external APIs dump them into mysql and this mysql is linked internally to some zope contents or templates. Its strange but this is there in place.

Our site has more dynamic contents being added on daily basis (mostly text) and does not seem to have lot of images stuff.
I think there are large objects in the zopedb and its more frequently accessing the db and doing more I/O; SPU load is not very high.

Based on my experimentation so far I can't agree to have higher number of cache objects and multiple threads and lesser instances (as per your blog) and also cant seem to agree with single threaded multiple instances as per CPUs.

  • How can I find the catalog size of the database and how many objects are there and how to determine the size values on average to get the idea?
  • How can I see recent db activity on my instance?

I am thinking to have 4 instances with 2 threads each with 20K objects and zeo-client-cache-size/zeo-client-blob-cache-size = 256MB/256MB and see the behavior.

FYI: I am not a python/plone programmer

you don't need to be one, but the issue you're having must be addressed by someone with experience deploying Plone sites.

you can find the size of your catalog by running an instance in debug mode (running something like bin/instance debug) and running the following commands:

>>> from zope.component.hooks import setSite
>>> site = app['Plone']
>>> setSite(site)
>>> len(site.portal_catalog())
72924

replace 'Plone' with your site id in case is different; as you can see there are 72.924 objects in the catalog of this site.

I have no idea how to get the average object size; that's a good question that must be addressed by someone else; I tried using the _p_estimated_size attribute of the objects but that gave me a value lower than I expected: 1.592.

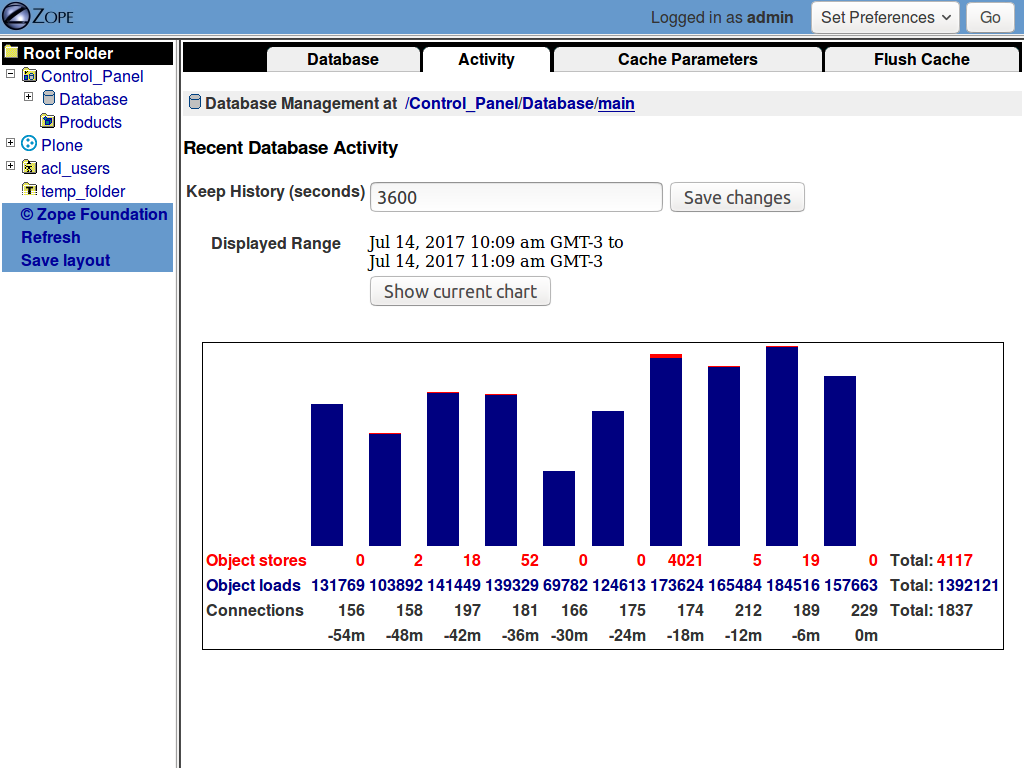
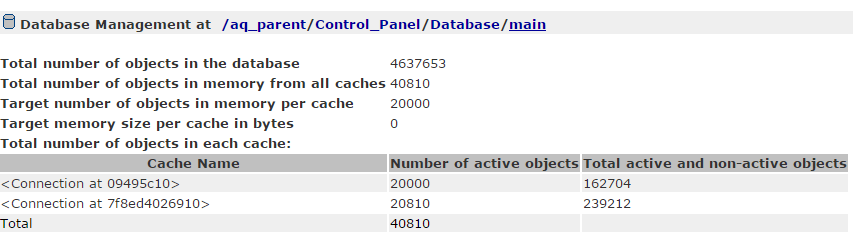
you can see the database activity on an instance by accessing the ZMI, and then selecting Control_Panel -> Database -> main -> Activity.

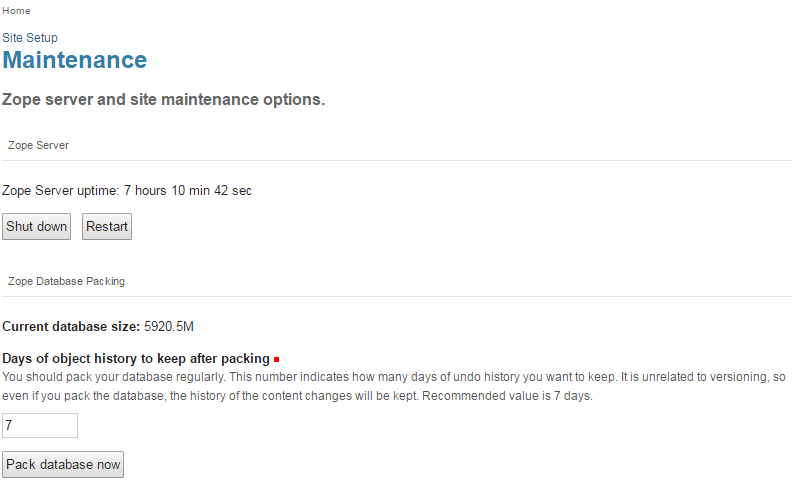
BTW, your Data.fs file is huge and you may need to compact the database. if after running that process you still see a file this big, then your objects are also huge and that may explain why the instances are consuming such amount of memory.

I still don't see the need of having 8 instances in your case; how many people is accessing your site? I have a site with 8 instances, but it has more than 4 million page view a month, and most of the backend traffic is caused by crawlers.

FYI, after I posted the statistics on the first server I noticed that something was really wrong with that site: 1.392.121 object loads in just one hour was not what I was expecting.

I plunged into the nginx logs and I discovered a lot of suspicious activity there from strange crawlers that I interpreted as a DoS attack.

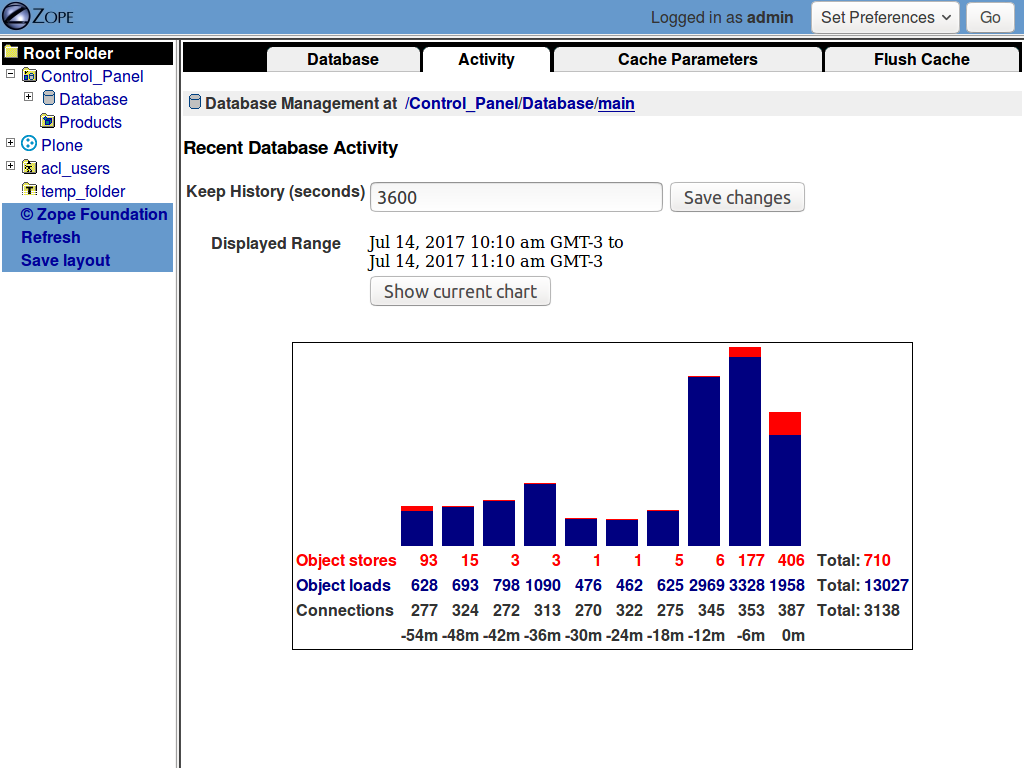
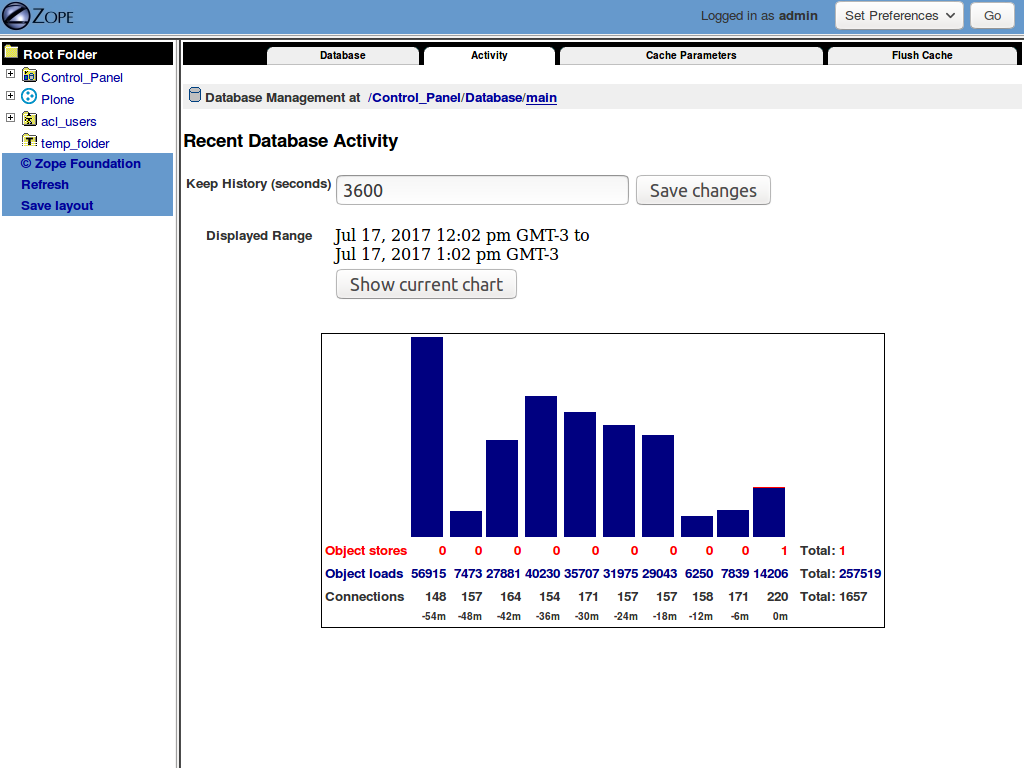
I blocked those crawlers and after that this is a more "normal" behavior:

now you can see "only" 257.519 object loads, which is still high, but 5 times smaller; I need to dig deeper.

1 Like

My catalog size is: 87140
Data.fs is 20GB
So this means there are a lot of objects in my zopedb and most probably some big sized as well.

I have Plone 4.3.3 - I do not see Control_Panel in my ZMI.
Typing mysite.com/Control_Panel/Database/main - does not show me anything but just the same ZMI - strange.

nginx logs do not show me anything usual.

Traffic for our site is very less. I have now reduced my those two instances to two threads - performance seems to be same; memory is not halved; but I notice that it looks like eventually these processes wants to takeover all the system memory. Feels weird.

Shall I completely disable cachig of zope objects and connections since traffic is not so high and just keep the cash of static files and images and with the varnish cash - to see the behavior?
If its not a bad idea - how shall I disable this type of caching while keep varnish and static stuff working cached?
Only from buildout?

your nginx configuration is probably removing the access to the Zope root on rewriting; try to access it using this acquisition trick (yes, acquisition is cool… sometimes):

http://www.example.com/aq_parent/manage

that's a very bad idea: you'll kill your site by doing that.

as I mentioned before, set the zodb-cache-size = 90000 at least and see what happens; you can do this on one instance only to be able to compare the results.

you don't have to run buildout for this: you can edit directly the configuration file stored in something like parts/instance1/etc/zope.conf; restart the instance after that to use the new settings.

yes, as I also mentioned before, you have a problem; you will probably need to hire someone to help you.

not me, BTW.

1 Like

This sounds like it could be one source of your problems. If you have custom content that is getting synced daily and large data is getting dumped into single objects that aren't blobs.... then they would be brought into memory everyday and blowing your cache up. The cache is not that smart, it doesn't pay attention to size. Your developers need to take that into consideration and most likely use blobs instead. This is just a theory.
Another possibility is this process stores some other data in memory outside of the DB that is removed on restart.
Do you notice any particular times or instances that get the large increase in RAM usage?

Does this database activity chart looks OKayish?
My site has max only 10 concurrent users and daily 1000 users.

Nobody has pack the database for this company I think for a year..
Shall I do that now, what are implications - such as I should do only in non-active hours for example.

Wow. Thats a lot of loads. Like @hvelarde said, you want to see more like a few thousand, thats all.
You either to ask what in your app needs to load that much data. Does your catslog have too many indexes? Is it a crawler? If so u can deal with that by using a loadbalancer that directs them to a single instanace to limit the loads on your other instances, or block them.
But I think you really need to get some consultant to look at what's your app is doing. Most likely it hasn't been built right.

I am guessing this separate MySQL DB as a pain from day one.[quote="djay, post:13, topic:4528"]
Do you notice any particular times or instances that get the large increase in RAM usage?
[/quote]

No, just that it takes up huge memory within an hour - after some hours (depending on threads and cache-object-size) its taken up the whole system RAM 15GB.

These are the cache parameters of two instances (at the moment 2 threads each with 20K entries):

Checked yesterday does not seems to be usual - I removed some and then functionality stopped working therefore I restored them.

Upon @hvelarde advised checked the nginx logs for unusual hits and crawlers (accessing robots.txt..) didn't seem unusual. For /robots.txt it was around 400 hits in 8 hours by various bots including internetarchive, googlebot, twitterbot.. Therefore I do not feel its gonna make any great impact other than 2% improvement on performance; but I am way far from that for now.

On our site company users upload videos, for last two years they were uploading lot of videos on our zopedb and some on the company's YouTube channel and then linking them - for couple of months back I advised them to only go via YouTube way and never upload a video directly. I doubt these binary data is in zopedb and not in blobstorage.
Is there anyway to find them, get list of them and advise users to re-fix all the history of video uploads/links and links of such videos on other pages/section of the company in order to reduce the database size and ultimately unnecessary cache.

No budget - volunteers are welcome : )

That's what I think from the day I put my hands on it.,
Once had an expert freelancer do the setup of loadbalancer and cache; he expressed the same.

we have helped you a lot already; I just have done so just because I appreciate the way you were doing your part.

even volunteers need rewards; nobody is going to fix somebody else's problem for nothing.

these are my final words on this thread: you have a complex problem that's beyond volunteering time; you and your organization must recognize that.

good day and good luck.

Thanks all for your support!
I think you guys have provided enough pointers for us to see in those directions.

The issue seems to be mostly inside the design of zopedb and the size of objects inside it - its not a simple shot and might need to redesign and redo some stuff which has not been done nicely or maybe in hurry.
Second bottleneck is the additional external dependency on MySQL based db which needs to be looked / re-code again.
Third thing is the configuration settings regarding deployment of processes, threads and cache parameters which I have now very well understood - and actually requires to play around till you get the optimal settings according to your own plone/zope setup

Thanks again - we can conclude this thread here.
When I have specific questions I will start a new thread.

CIAO