Short version: I wrote a package that gives Plone proper Kubernetes-style health probes and a metrics endpoint, and it's now on PyPI as a beta under the plone namespace.
This post is the why more than the how — the how is in the README.
I worked a lot with deployments on Kubernetes the last years and found a whole ecosystem there with excellent metrics and startup support. My beloved Plone: We have /ok. Well. Time to change this. So I sketched PLIP 4313. And some agentic coding session later, tatataaaa: A wild unknown package emerged. Now I am testing it - so it's beta.
The problem: @@ok lies to you
Plone has @@ok. It returns OK. Always. It returns OK whether the ZODB is reachable or not, and it keeps returning OK right up until the process is so busy it can't answer at all — which is exactly the moment you wanted to know something was wrong.
That's fine as a "the WSGI server accepts connections" check. It is not a health check. In a container platform you need to answer three different questions, and @@ok answers none of them properly.
Liveness, readiness, startup — they are not the same thing
Kubernetes (and Nomad, and friends) don't have one health check, they have three, because they trigger three different reactions:
-
Liveness — "is this process still sane, or is it wedged?" If the liveness probe fails, the kubelet kills the container and restarts it. So a liveness check must be cheap and must not depend on things outside the process. If you put a database check in here, a short DB blip turns into a restart storm across every pod at once. Don't do that.
-
Readiness — "can this process serve real traffic right now?" If readiness fails, the pod is pulled out of the Service load balancer but not killed. This is where the ZODB connectivity check belongs: no database, not ready, stop sending it requests — but give it a chance to recover instead of nuking it.
-
Startup — "has this thing finished booting yet?" Plone is not a fast starter. Without a startup probe, Kubernetes starts running liveness checks immediately, the slow boot looks like a wedged process, and you get killed in a restart loop before you ever come up. The startup probe holds the others off until the app reports it's up once.
Three questions, three reactions. Collapsing them into one endpoint that returns a static string is how you get pods that flap, or pods that happily stay in rotation while every request 500s.
plone.observability exposes them as /live, /ready, /startup, each returning proper JSON and a 200/503 you can actually probe against.
Why a separate port and a separate thread
Here's the part people get wrong. If your health endpoint runs inside the normal WSGI app, on the normal port, served by the normal worker threads — then when all those worker threads are stuck (slow ZODB, a thundering herd, a runaway request), your health endpoint is stuck too. The liveness probe times out, Kubernetes assumes the worst, and starts restarting things, which is frequently the worst thing to do under load.
So the health server in this package runs on its own port (8081 by default) in a daemon thread, completely separate from the Zope/WSGI request path. When the main pool is saturated, the health port still answers. The liveness probe sees "process is alive, just busy" instead of "process is dead, restart it."
Second reason for the separate port: you don't want /live and friends exposed on the public content port. In k8s you map the probe port for the kubelet and leave it off your ingress. Probes are infra plumbing, not content.
I had this pain in reality, and it's hard to impossible to fix without this package. There's no sane way to tell what's going on.
Metrics: why an endpoint at all, and how it gets consumed
Logs tell you what happened. Metrics tell you how much and how often over time — request rates, latency distribution, thread saturation, ZODB cache behaviour, content counts. You can't graph or alert on what you don't expose.
The model in the container/k8s world is pull, not push. You don't ship metrics anywhere. You expose a plain text endpoint, and Prometheus scrapes it on an interval (every 15–30s, typically). In Kubernetes you wire that up with a ServiceMonitor/PodMonitor (Prometheus Operator) or scrape annotations — you point Prometheus at the endpoint and it does the rest. Grafana then reads from Prometheus for dashboards, and Alertmanager fires on the same data.
So the package ships a @@metrics view that emits Prometheus text format (and JSON, if you'd rather). Out of the box you get Zope runtime stats, ZODB stats, process RSS/CPU, content counts, and request timing as a proper histogram.
One thing we're careful about: the metric labels stay low-cardinality — auth state, status code, latency bucket, all bounded. User identity never goes on a metric, only on a trace span. Slapping a per-user label on a metric is the classic way to make Prometheus fall over.
Note the deliberate split: health probes live on the separate port, but the metrics endpoint lives on the normal Zope port. That's on purpose. Metrics need the application and the ZODB to produce real numbers — they're app-level data, and it's fine if a saturated app scrapes slowly. Health probes are the opposite: they must answer especially when the app can't. Different jobs, different places.
If you do not want your metrics exposed publicly, an allowed CIDR range can be configured. If you are more on the paranoid side, NetworkPolicies in K8s are available.
Extensible, because your add-ons have state too
A unified system is only useful if everything plugs into it. Solr, a Celery queue, an external API you depend on: they all have health and metrics worth surfacing. So checks and metrics are registered through the component architecture: implement ILivenessCheck / IReadinessCheck for a check, or an IMetricProvider adapter for metrics, register it, done. Your readiness probe now also knows whether Solr is reachable.
Optional: OpenTelemetry tracing
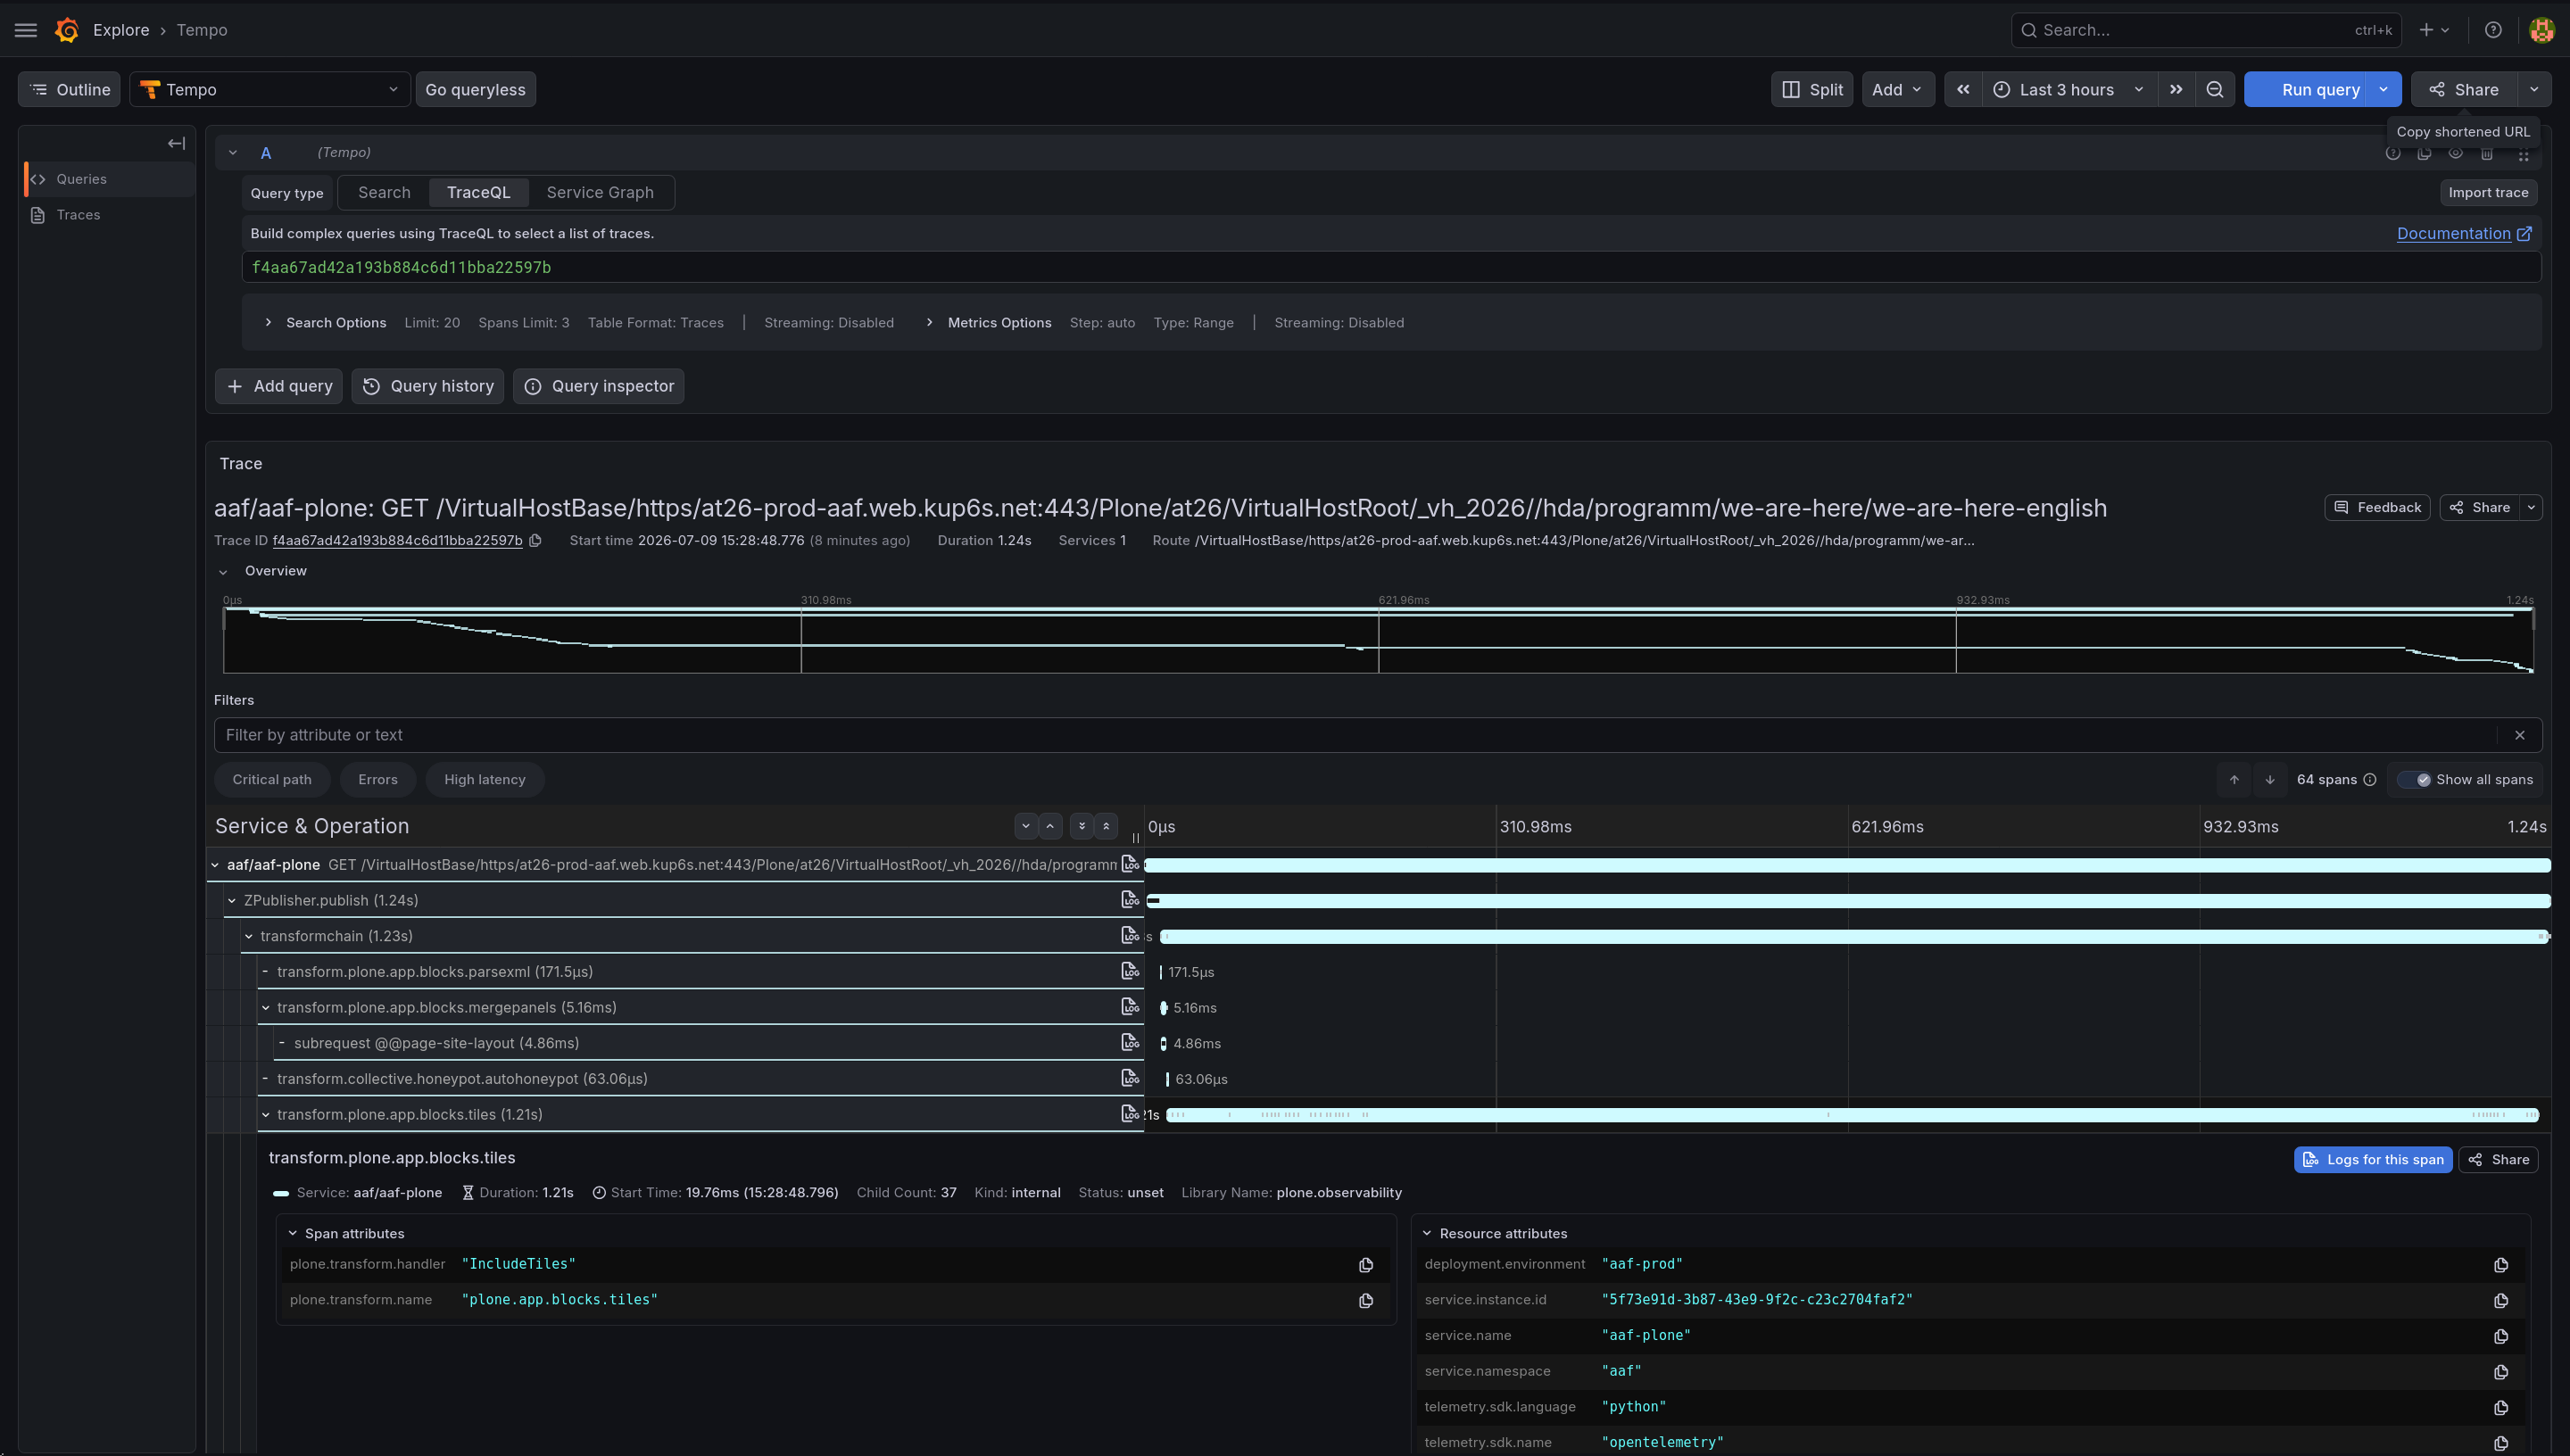
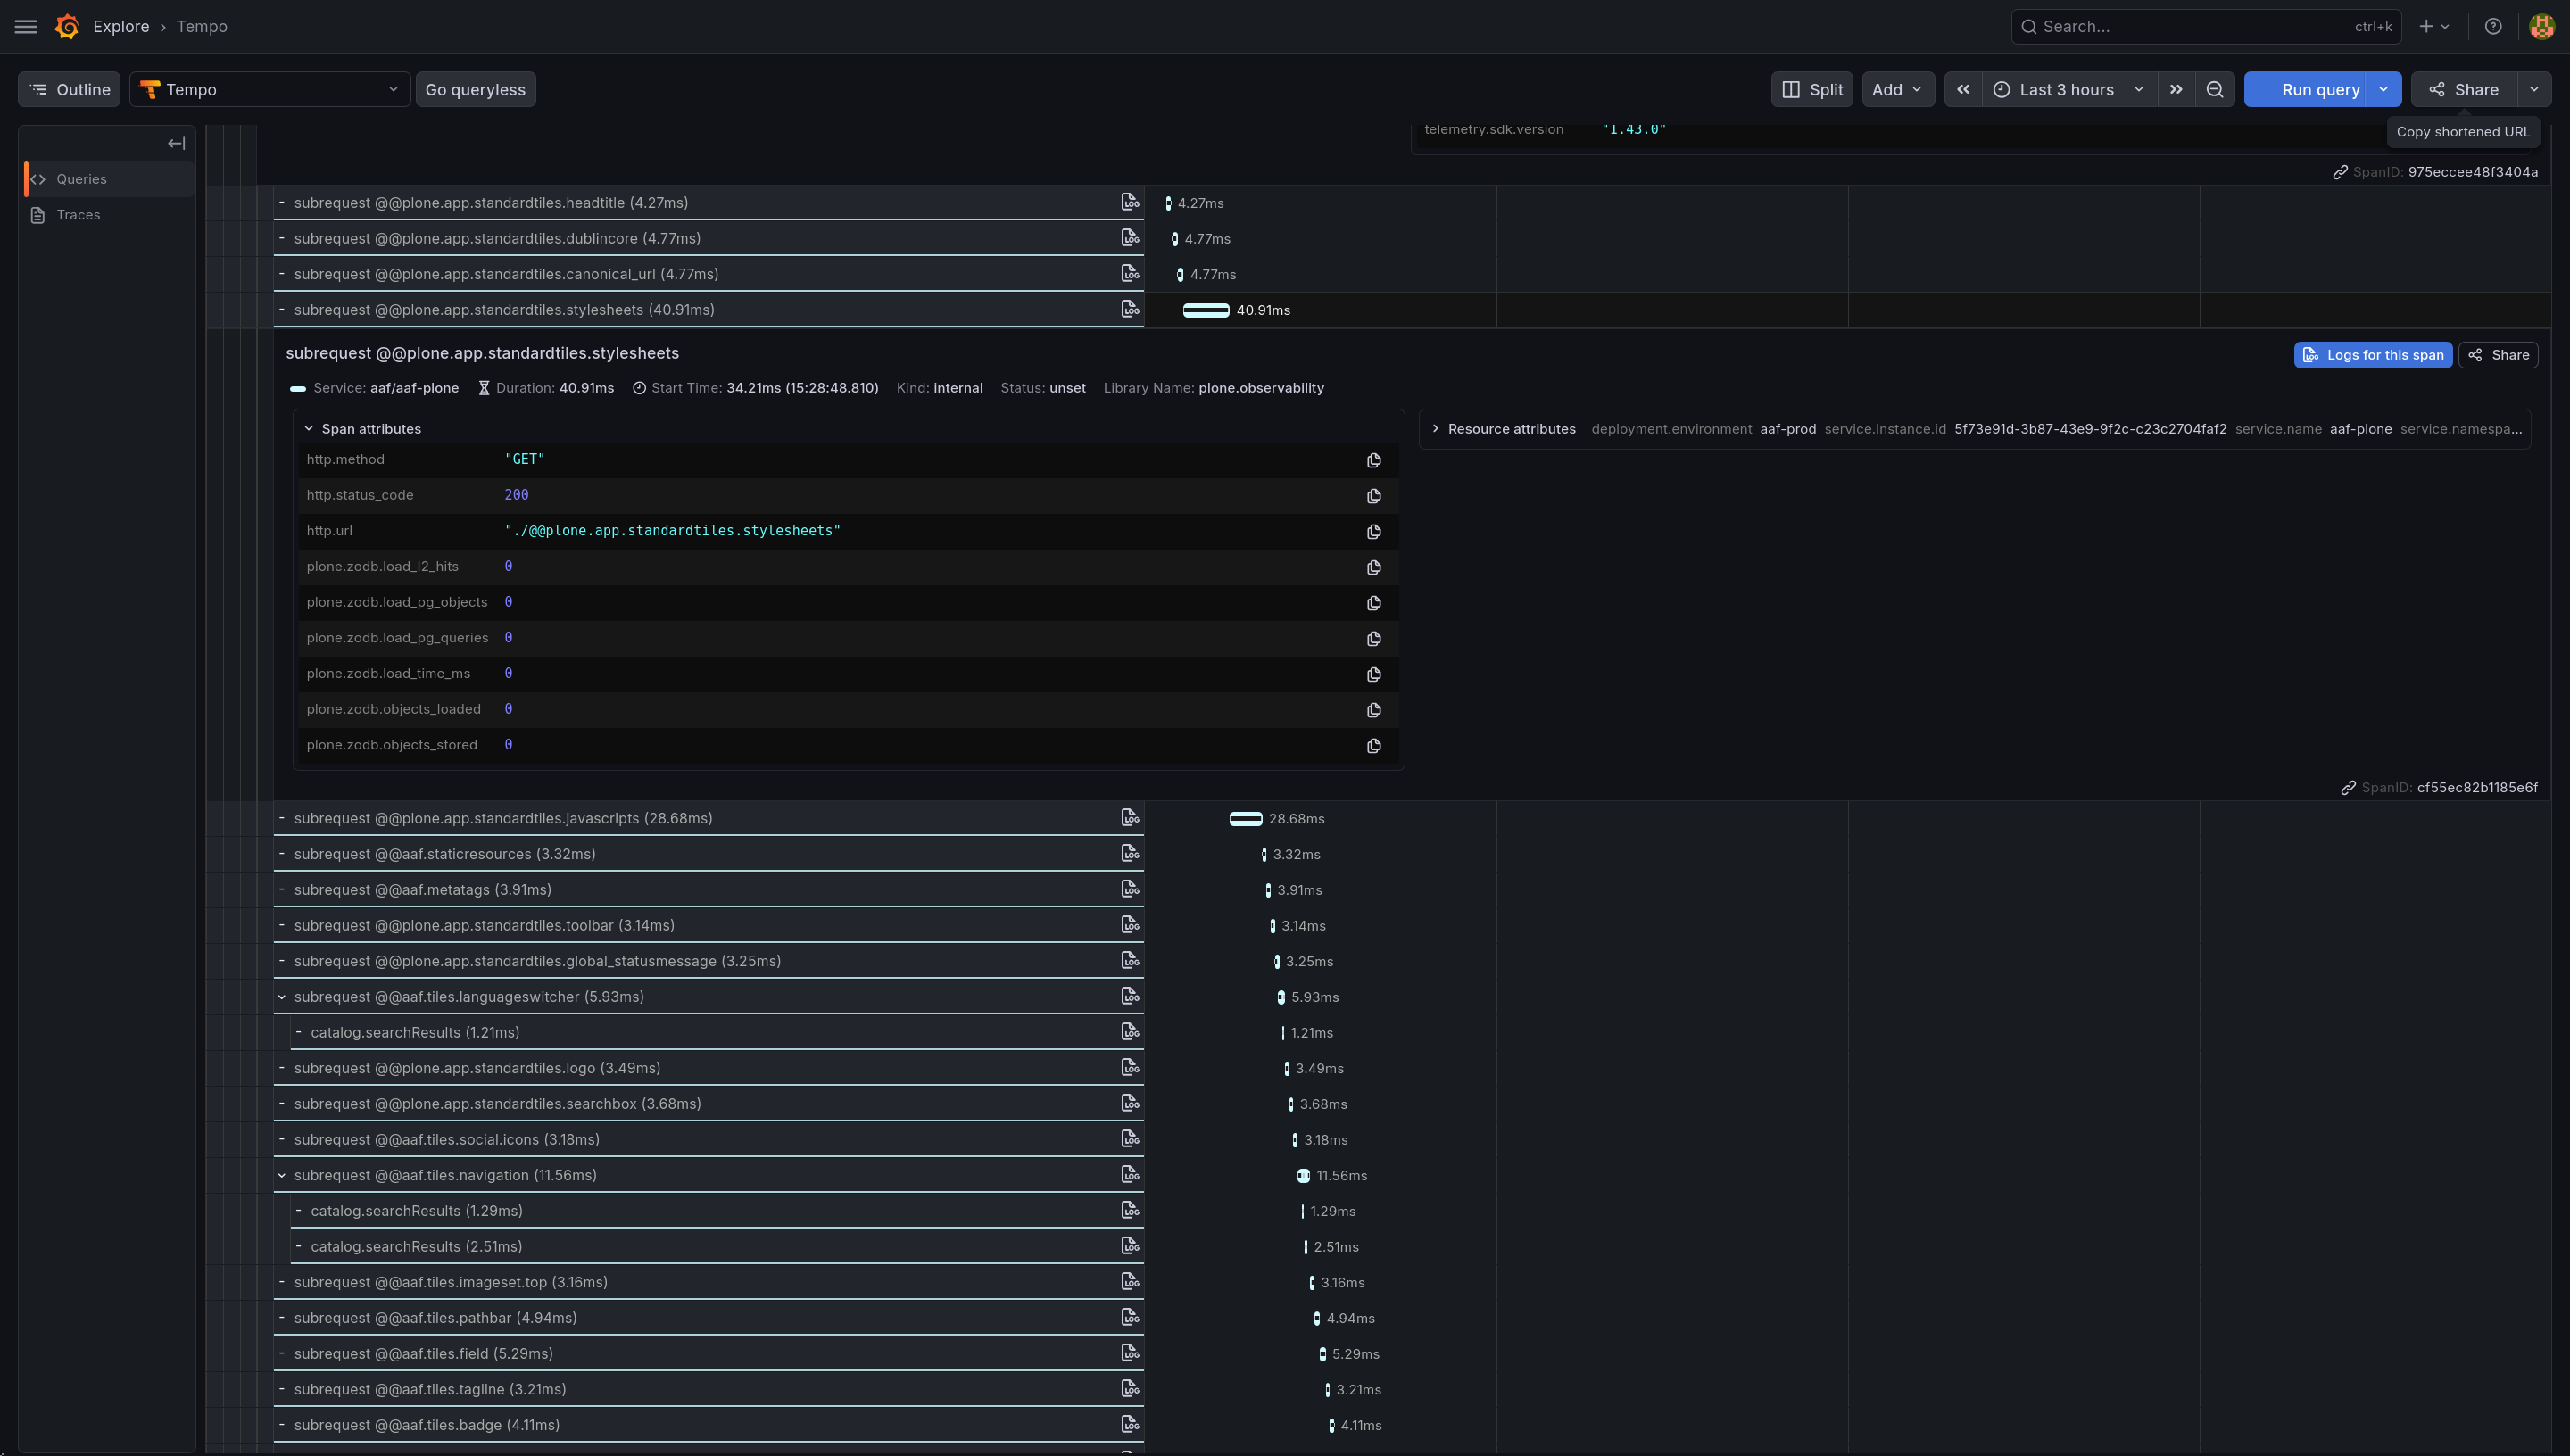
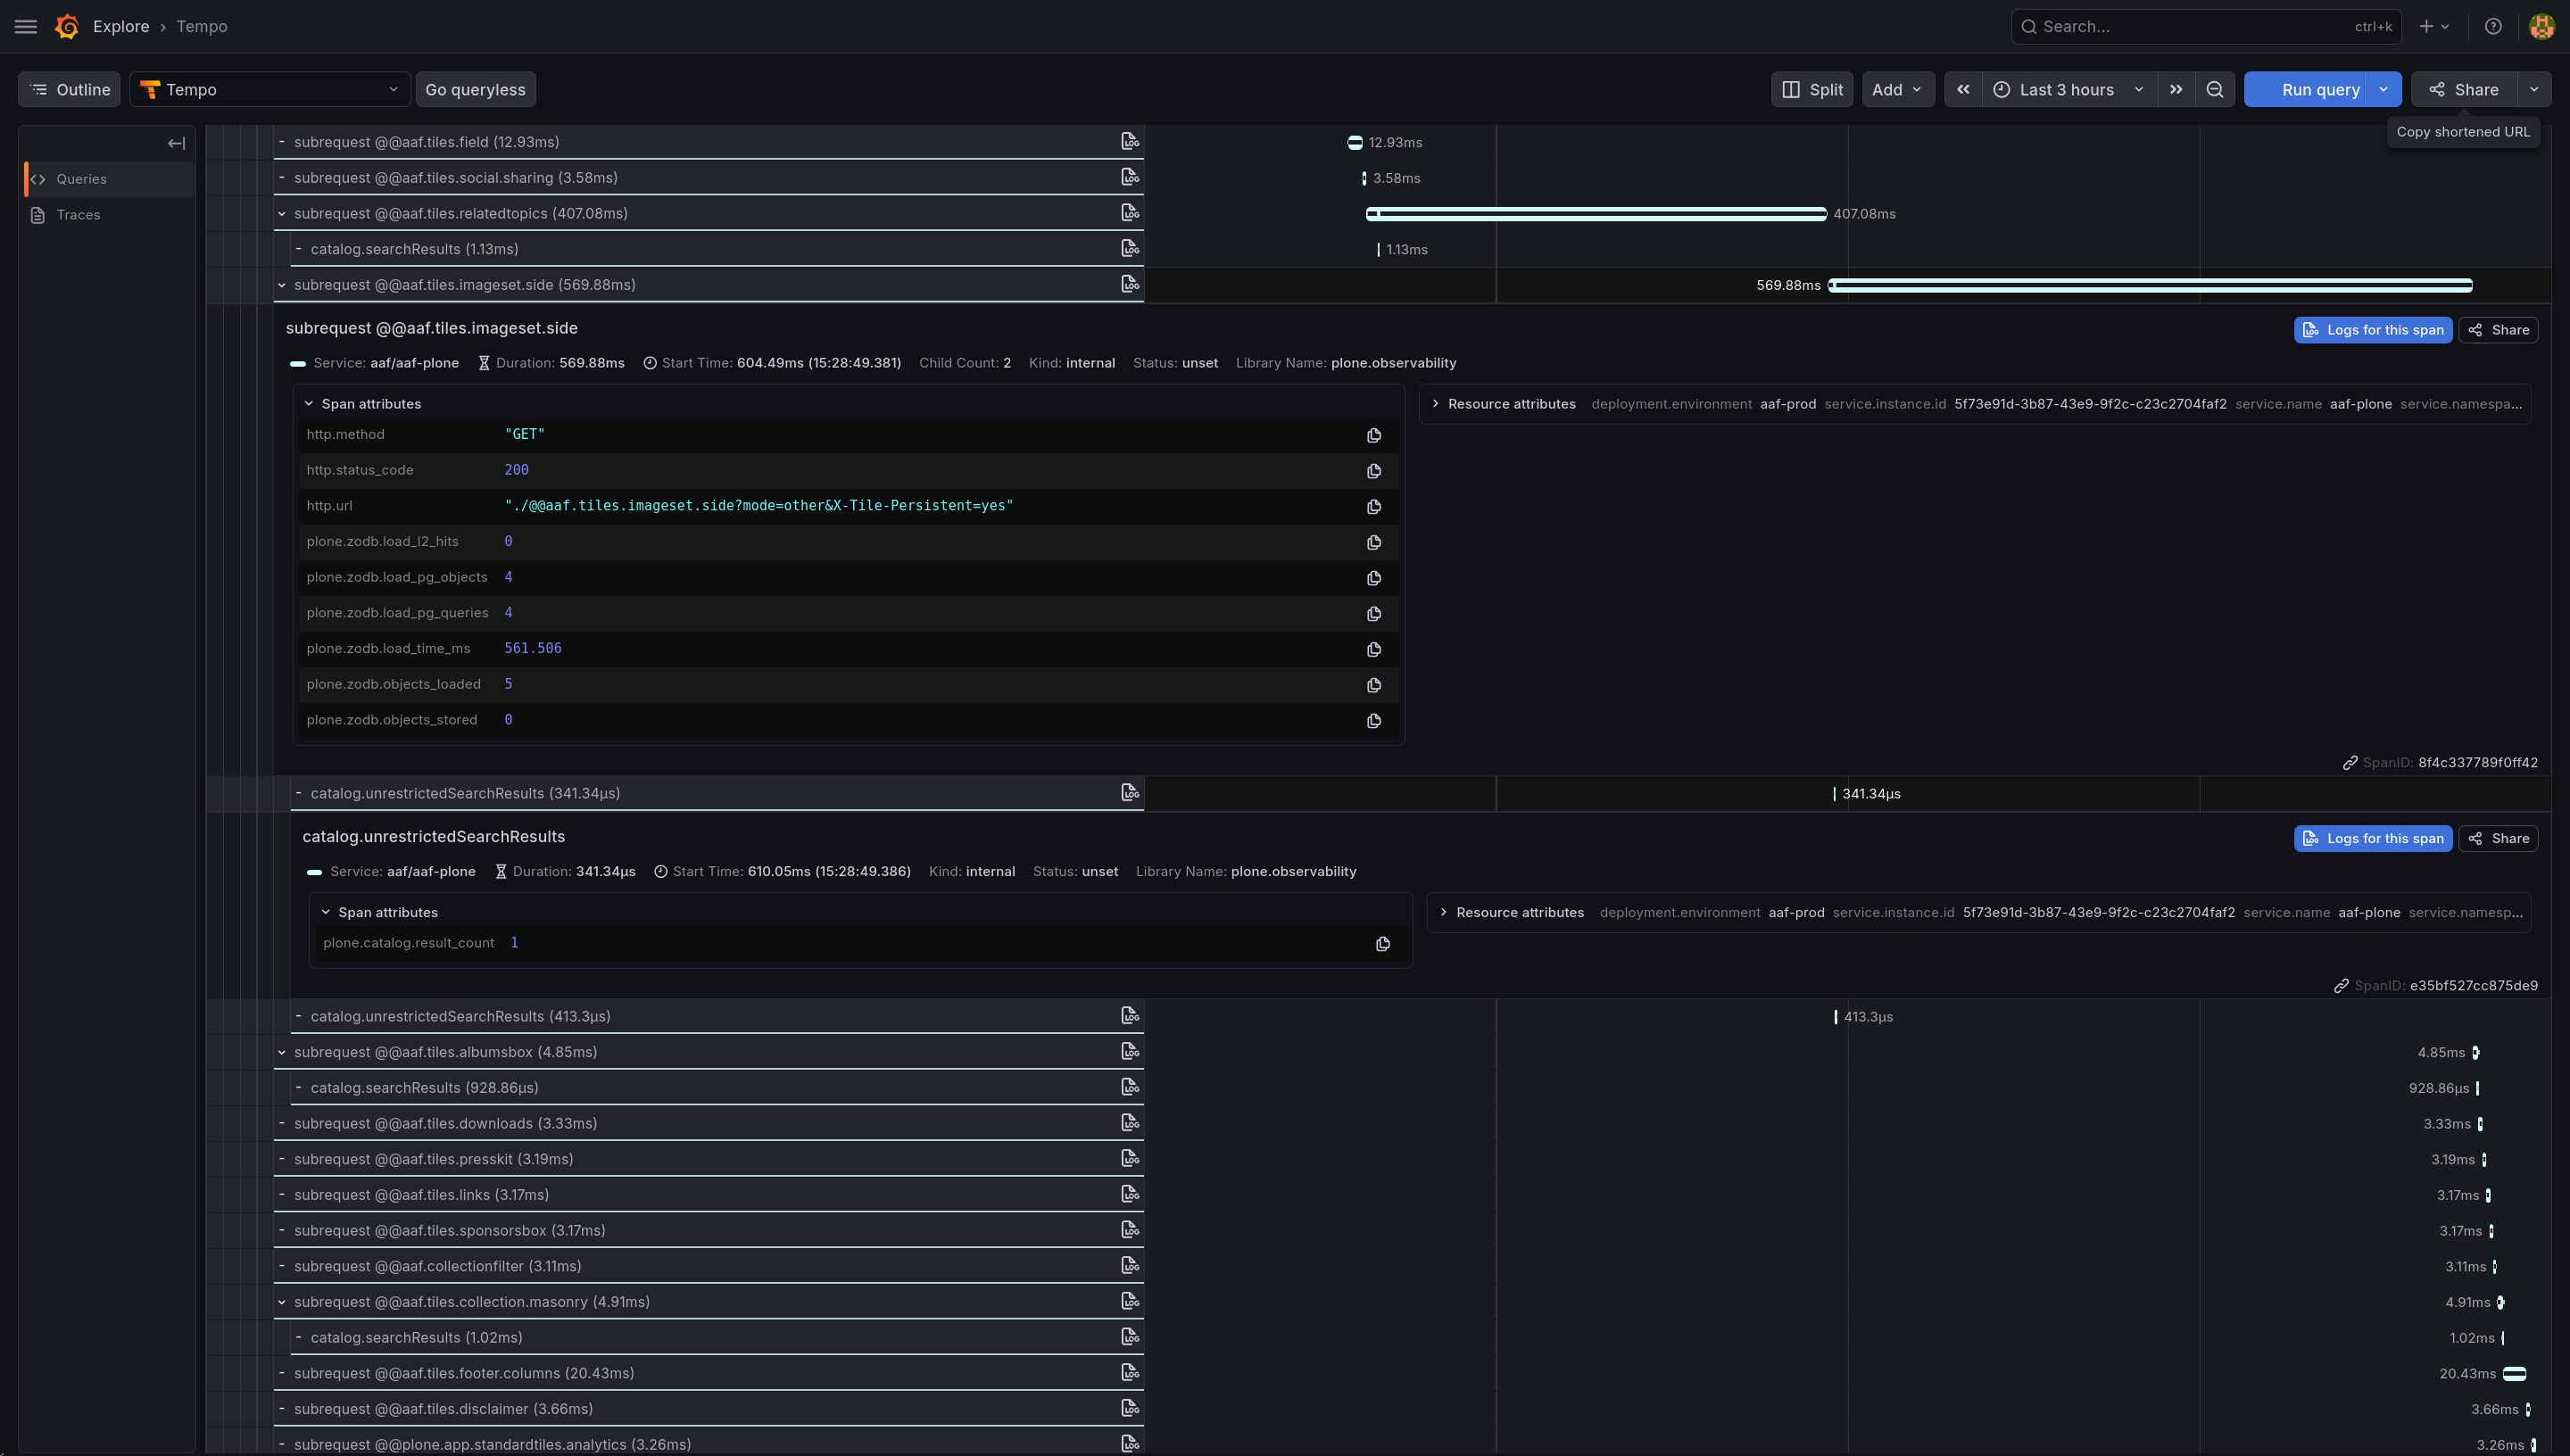
There's an optional [opentelemetry] extra for distributed tracing — request spans plus the expensive Plone internals (traversal/publish, catalog queries, ZODB commits), wired up the OTel-native way via the standard OTEL_* env vars. Metrics stay Prometheus-native on purpose: a Prometheus endpoint is already consumable by the OpenTelemetry Collector, so you don't need the SDK just to get metrics out. Tracing is the part that genuinely needs OTel, so that's the part that's behind the extra.
In a PLIP comment David Glick pointed me to his draft at collective.opentelemetry. So I stole some of the ideas and integrated them in plone.observability (attributed).
This OpenTelemetry part at time of writing is TDD and theory only. I do not use it currently in production. So any testers with any type of response of this are very appreciated!
Status and where to get it
It's a beta on PyPI:
pip install plone.observability

pip install "plone.observability[opentelemetry]" # if you want tracing
Repo and full docs (Kubernetes probe config, Prometheus scrape config, the extension points):
This started as PLIP 4313 - the idea being that this kind of thing should arguably be part of how you run Plone, not something everyone reinvents per project. For now it's an opt-in add-on under the plone namespace.
So, check it out, test it, any contribution is highly appreciated!
 Filed: