 Any idea, how to resolve?
you are not giving enough information to help you; read these posts:
You might have some luck calling strace on the process, e.g.:
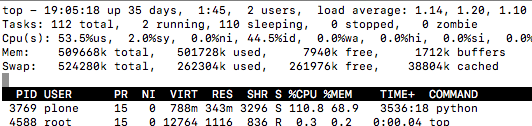
sudo strace -p 3769
Thanks for your info.
This plone site is running with a single plone instant not front end + ZEO and the cpu usage sometime result super high during edit the site, and then it hang and not server.
usually high CPU means your site is processing more requests it can handle because, a) poor caching configuration at any level (ZODB, plone.app.caching, fontend caching…), b) unoptimized code, or c) everything is fine and you just need more backends.
please do your homework first and come back with more hard information; another must read thread:
Thx for the info.
You must understand what is causing this behaviour.
There is a tool around which allows you to send a signal to the Plone process and cause it to dump the tracebacks of all threads. This way, you can see what is happening in your hanging system. I forgot its name (and I have never used it myself).
I, instead, typically use haufe.requestmonitoring to analyse situations like this. This package allows you to set up and configure a long running request monitor. The monitor dumps tracebacks for long running requests after every x seconds (configurable). Thus, you get a good view on the behaviour of long running requests and where they spend their time.
Both of those tools build on top of threadframes, a Python extension which allows to analyse the stack trace of all Python threads in a process.
2 Likes
There is a tool around which allows you to send a signal to the Plone process and cause it to dump the tracebacks of all threads.
I think Dieter refers to sending the signal USR1 to your instance (kill -USR1 3769) in your case.
Anyway he is right: tools like haufe.requestmonitoring or Products.LongRequestLogger are a must.
1 Like
This is great info – is it in our documentation? If not, it should be.
indeed, but I bet 80% of the time a performance problem is a configuration problem: check that first always and come to this low level tools only after confirming you really have to use them.
Products.LongRequestLogger is something we don't use anymore, as you can get the same information using the tools you already have on your stack, like nginx and Varnish.
a lot of common sense is also needed; I have a pending blog post on how we are using HAProxy now and what problems it helped us to solve.
re-reading the question I see this:
which point to an overuse of this single-thread instance with no front end web server, and probably no caching neither.
the most simple test you can do is just adding another thread to you server:
[instance]
zserver-threads = 2
note that this will increase your memory consumption by almost a 2x factor.
1 Like
Will try and thanks alot
If I don't run ZEO + Cleints and using a VPS with single core is that "zserver-threads" will speed up too?