I sort of hinted at a description of how we profiled our plone site at RFA in my previous post: How we got a 10x Performance boost at Radio Free Asia
I figured I'd take some time and share it.
Please be advised that this work is completely my own.
I am in no way promoting that this is the perfect way to do performance profiling in Plone. It just was the fastest thing I could pull out in a time of need.
What I mean is, I didn't really consult anyone on best practices, pitfalls, or just 'bad science' that can occur with this method. In fact, that's why I'm here - peer review. Please comment if I went wrong somewhere.
#Let's start at the Template
Because I had no other place to start. The ZMI database cache was pegged, the slow query log was not helping. Pages were taking 3-4 seconds to load. That's all the information I had. Standing over the sysadmin's shoulder probably would give me little help. We know it's the code.
I created a quick and dirty browser view that kicks off cProfile, so I can call it from templates:
at the top of my main_template.pt I put this in:
<tal:x tal:define="profiler context/@@profiler;
                   dummy python:profiler.start(filename='control.pstat');
                   >
.... The rest of my main_template.pt ...
and the bottom
    <tal:y tal:define="dummy python:profiler.stop()" />
</tal:x>
I also can set the output filename in the template, so I can quickly change it to grab test data.
In hindsight, I probably could have used the context and request to create a unique filename... but... whatever....
I threw the python code in a sub directory of my main product, because I like that:
performance_profiler/
├── configure.zcml
├── __init__.py
├── profiler.py
and added it to my main configure.zcml:
<include package=".performance_profiler" />
Being careful not to check this in. Adding profiling code to a production website is not a good idea - especially if you're looking to speed it up.
But basically, the template is now instructing the view to start and stop python's built-in cProfile tool.
https://docs.python.org/2/library/profile.html
Now, restart the server, and request a page - any page (that uses the macro in the main_template)
and magically, you have a file appear called 'control.pstat' in your instance's directory.
you can read this with the primitive pstats python module from the command line:
$ python -m pstats control.pstat
Welcome to the profile statistics browser.
% help
but I was using kCacheGrind - it's pretty
$ sudo apt-get install kCacheGrind
(or yum, or build from source, whatever)
$ sudo pip install pyprof2calltree
(converts python profiles to calltree format)
$ pyprof2calltree -k -i control.pstat
convert the file and launch kCacheGrind with output:
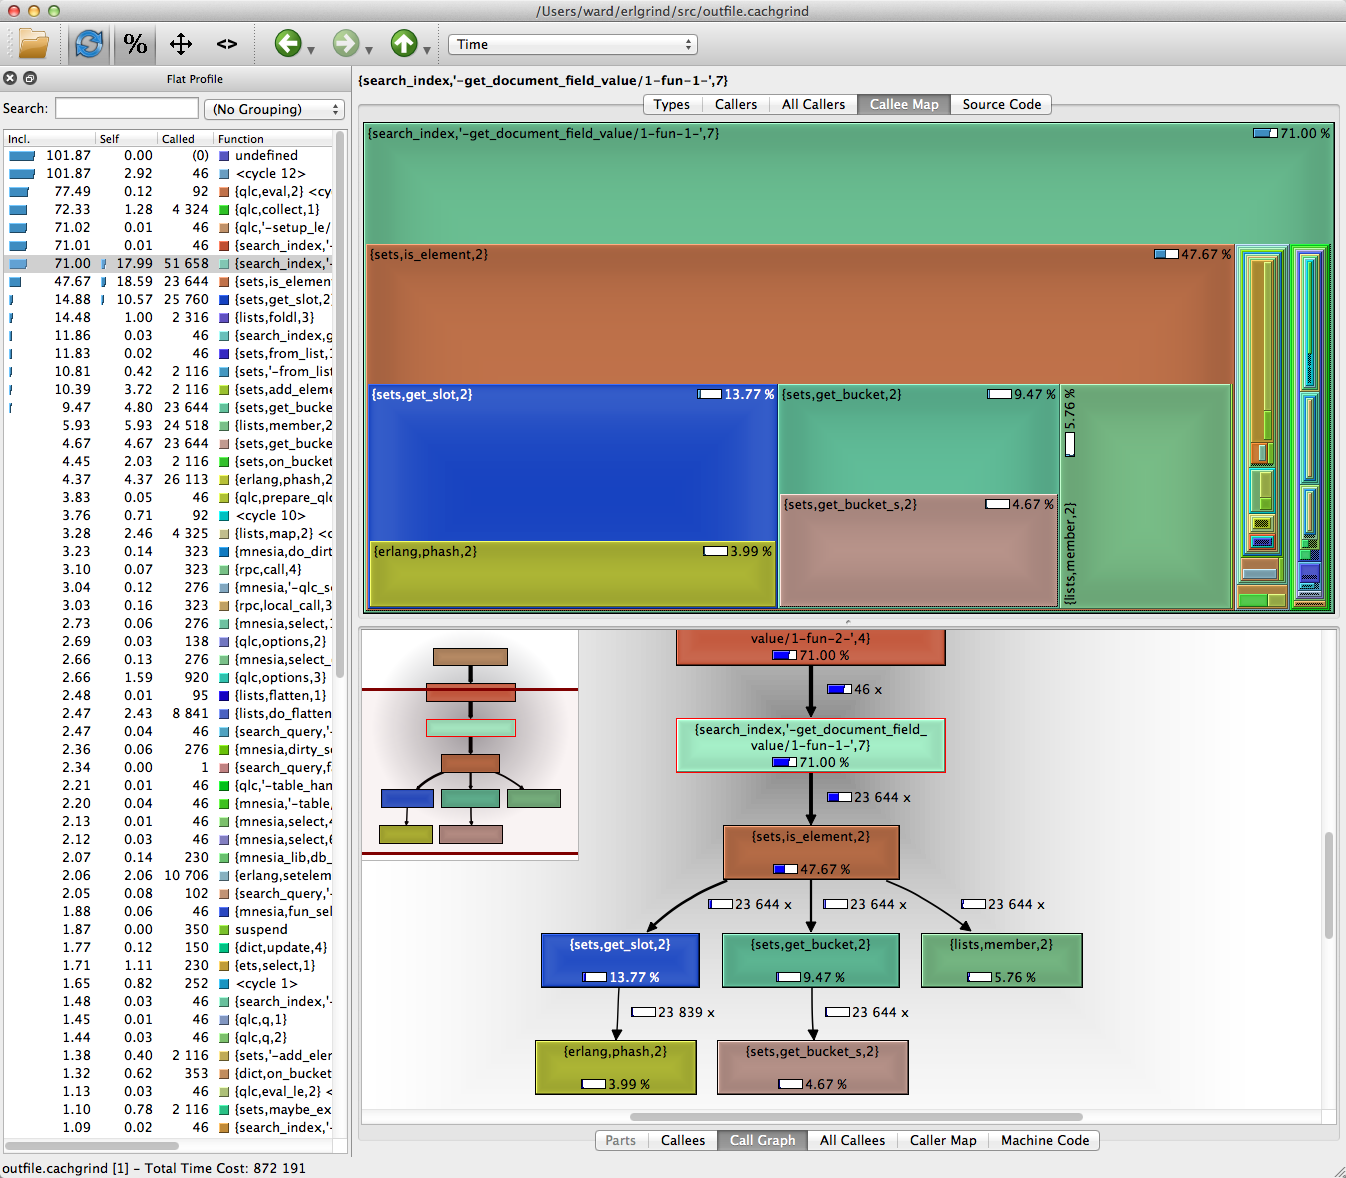
(Image is a sample from the web, and not Plone related)
And this is what clued me in that I was calling pt_render about 10 times more than I expected.
I also discovered a few more places that were taking up a significant amount of time, or being called repeadedly and could be cached.
The point of this output is to find a piece of code or two that a 1-hour refactor can significantly increase performance. Going farther than that is typically a waste of time. Without discipline you can spend weeks or months tweaking code to get a few more milliseconds, but there isn't much payoff. Also, as a general rule, the more you optimize code, the less readable and maintainable it becomes. There are tradeoffs.
remember:
"Programmers waste enormous amounts of time thinking about, or worrying about, the speed of noncritical parts of their programs, and these attempts at efficiency actually have a strong negative impact when debugging and maintenance are considered. We should forget about small efficiencies, say about 97% of the time: premature optimization is the root of all evil. Yet we should not pass up our opportunities in that critical 3%." -Donald Knuth
kCacheGrind also won't tell you what data is being processed, just how much time you spend in each function. Adding a set_trace() to that one function that seems to be doing too much or called too many times, even if it's in an egg, can really shine a light on where you went wrong.
like <tal:condition tal:if='image'>
This also lead me to reading about Plone query optimization:
we are spending a TON of time in <BTrees._IIBTree.intersection> because more indexes are NOT better. Did you know that adding a path to a query can slow it down, not speed it up?
Question: How can I avoid having btree intersections? My research says that zodb query time is logarithmic if you use a single index, but can become linear if using more than one - and I think this is the evidence.