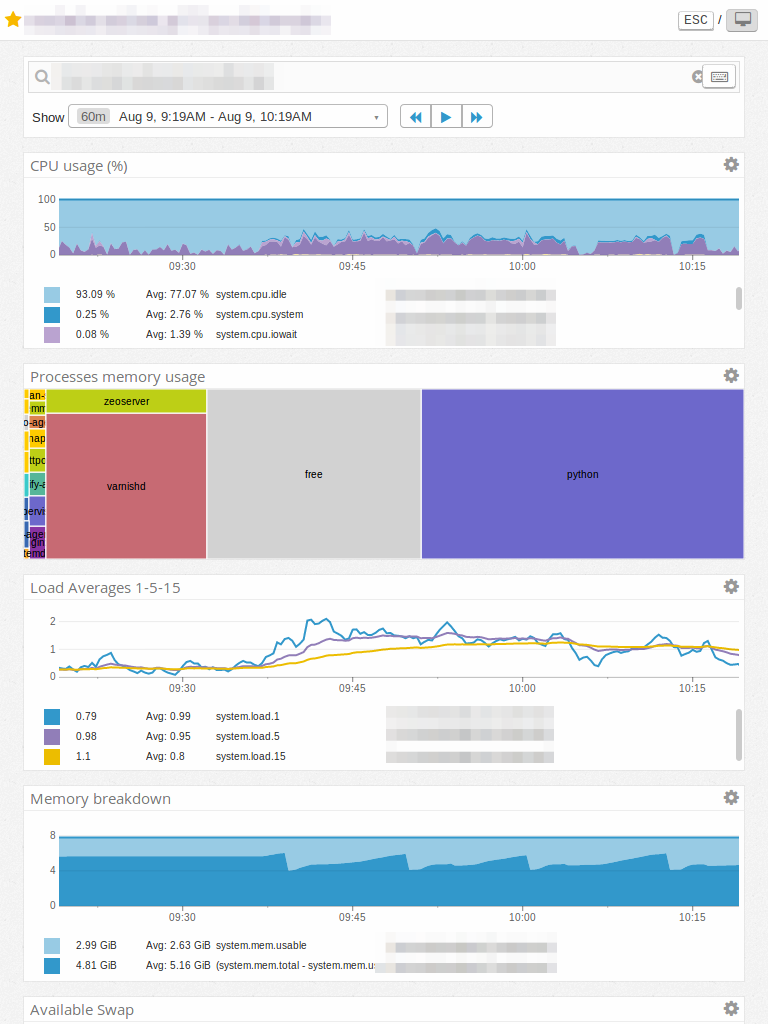
Today we have a problem with the site of one of our customers: they reported backend error and we started spotting high resource consumption and continuous instance restarts:
After more than one hour looking for possible DoS attacks, they finally told us they were trying to recover the password of a user, and a quick search on the logs showed us a correlation between the times of the high consumption and the access to the @@usergroup-userprefs view in the control panel.
Is there a way to track memory consumption per request? How can we find possible memory leaks or requests consuming a high amount of memory?
How do you deal with this kind of issues?