I'm trying to figure out the average request time on our backend and I found haufe.requestmonitoring; nevertheless, I found its documentation not pretty clear.
does anybody here is using it? can you share some log samples to see what's achieved with it?
Both can give you a good insight of the views that are taking too much time to render and an checking the logs you can estimate which method is consuming more cpu cycles.
Back to your initial request, if you are looking for the average response time I think the easiest way is to log it with your frontend proxy.
From a quick search I found:
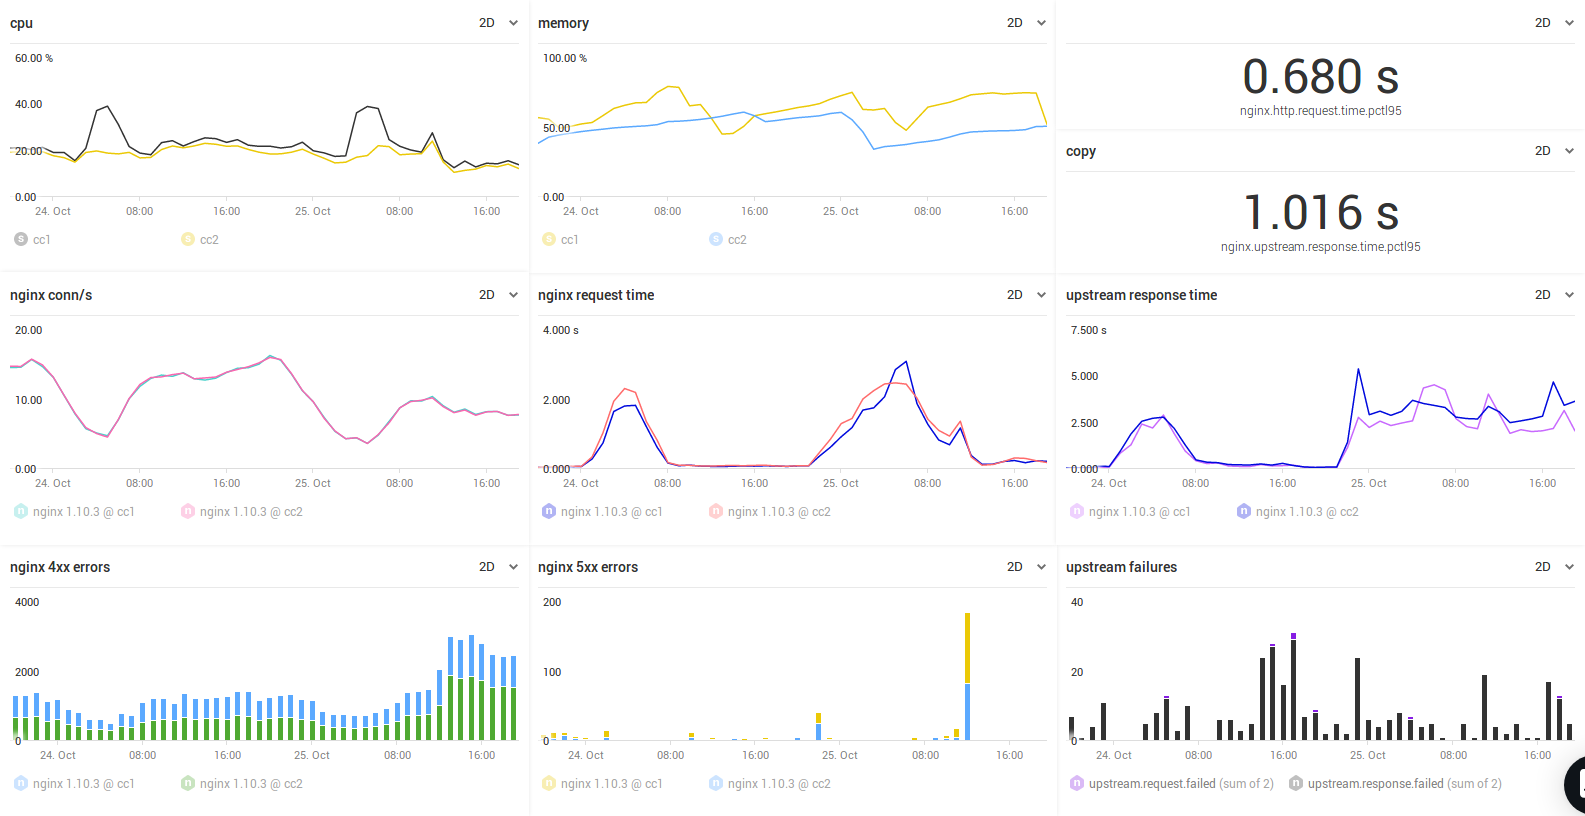
as you can see I have an average for request time and response time, 0,680 and 1,016 seconds over the last 2 days.
I'm fighting hard DDoS attacks trying to keep the sites fast and available and it's really a nightmare.
yesterday at 21:30 I noticed a huge increase in request times and I'm still not being able to identify the root cause.
I identified an increase in crawlers requests and I ended limiting them to avoid further issues, but the backend is still suffering and I have no idea what's causing it.
I will try haufe.requestmonitoring later, but I think we must have a simpler way to record this; patching the access log to include request time could be way easier.
We used a plugin which I can't for the life of me remember the name of. But it gave stats on several key timings for the request including zodb load times, diazo render times as well as total request time. And it also gave this is a http header as well as in the logs. Was really useful as a first step to seeing why requests were slow.
I think it might have been by enfold. A few searches haven't turned up the name yet.
@hvelarde : If you are interested in timeseries logging of request time and its components, @jensens created an interesting module for this I've been tinkering with it to also get Diazo rendering time visible, but I never finished/put it in production. And it is based on statsd output: https://github.com/collective/zperfmetrics