medialog.plotly how to add plotlybehaviour in content type
https://docs.plone.org/external/plone.app.dexterity/docs/advanced/behaviours.html
or by using the content-types configuration option of Plone.
-aj
I couldn't understand the usage part . Can u explain with steps. I would be a great help for me. The plotly is not showing in my content types
You need to add the plotly behavior, in the dexterity control panel (or in code).
For example, if you need it for 'Page', add it at:
http://localhost:8080/Plone/dexterity-types/Document/@@behaviors
thanks dude . Really helpful.
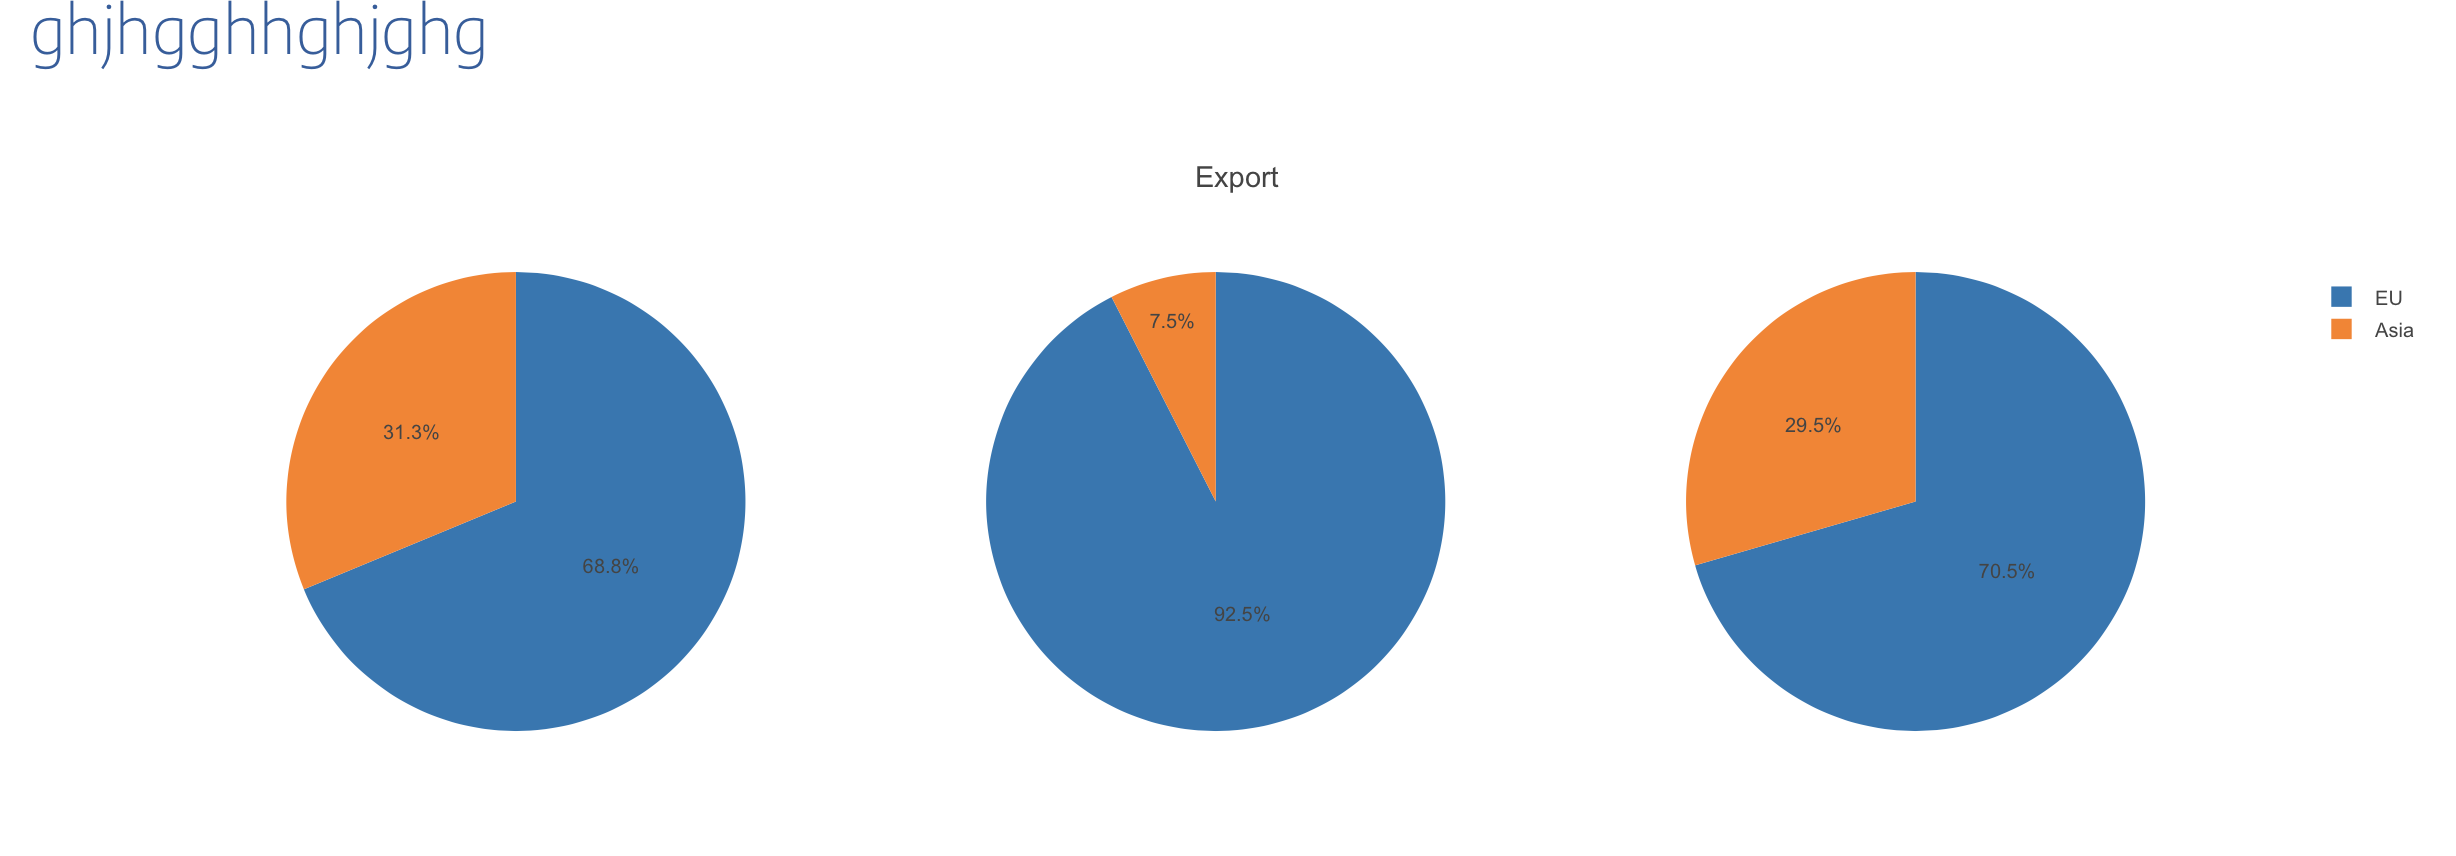
When I create a chart it is not displaying in the page.
What does this package do . I couldn't insert X axis legend. Let me post the screenshots
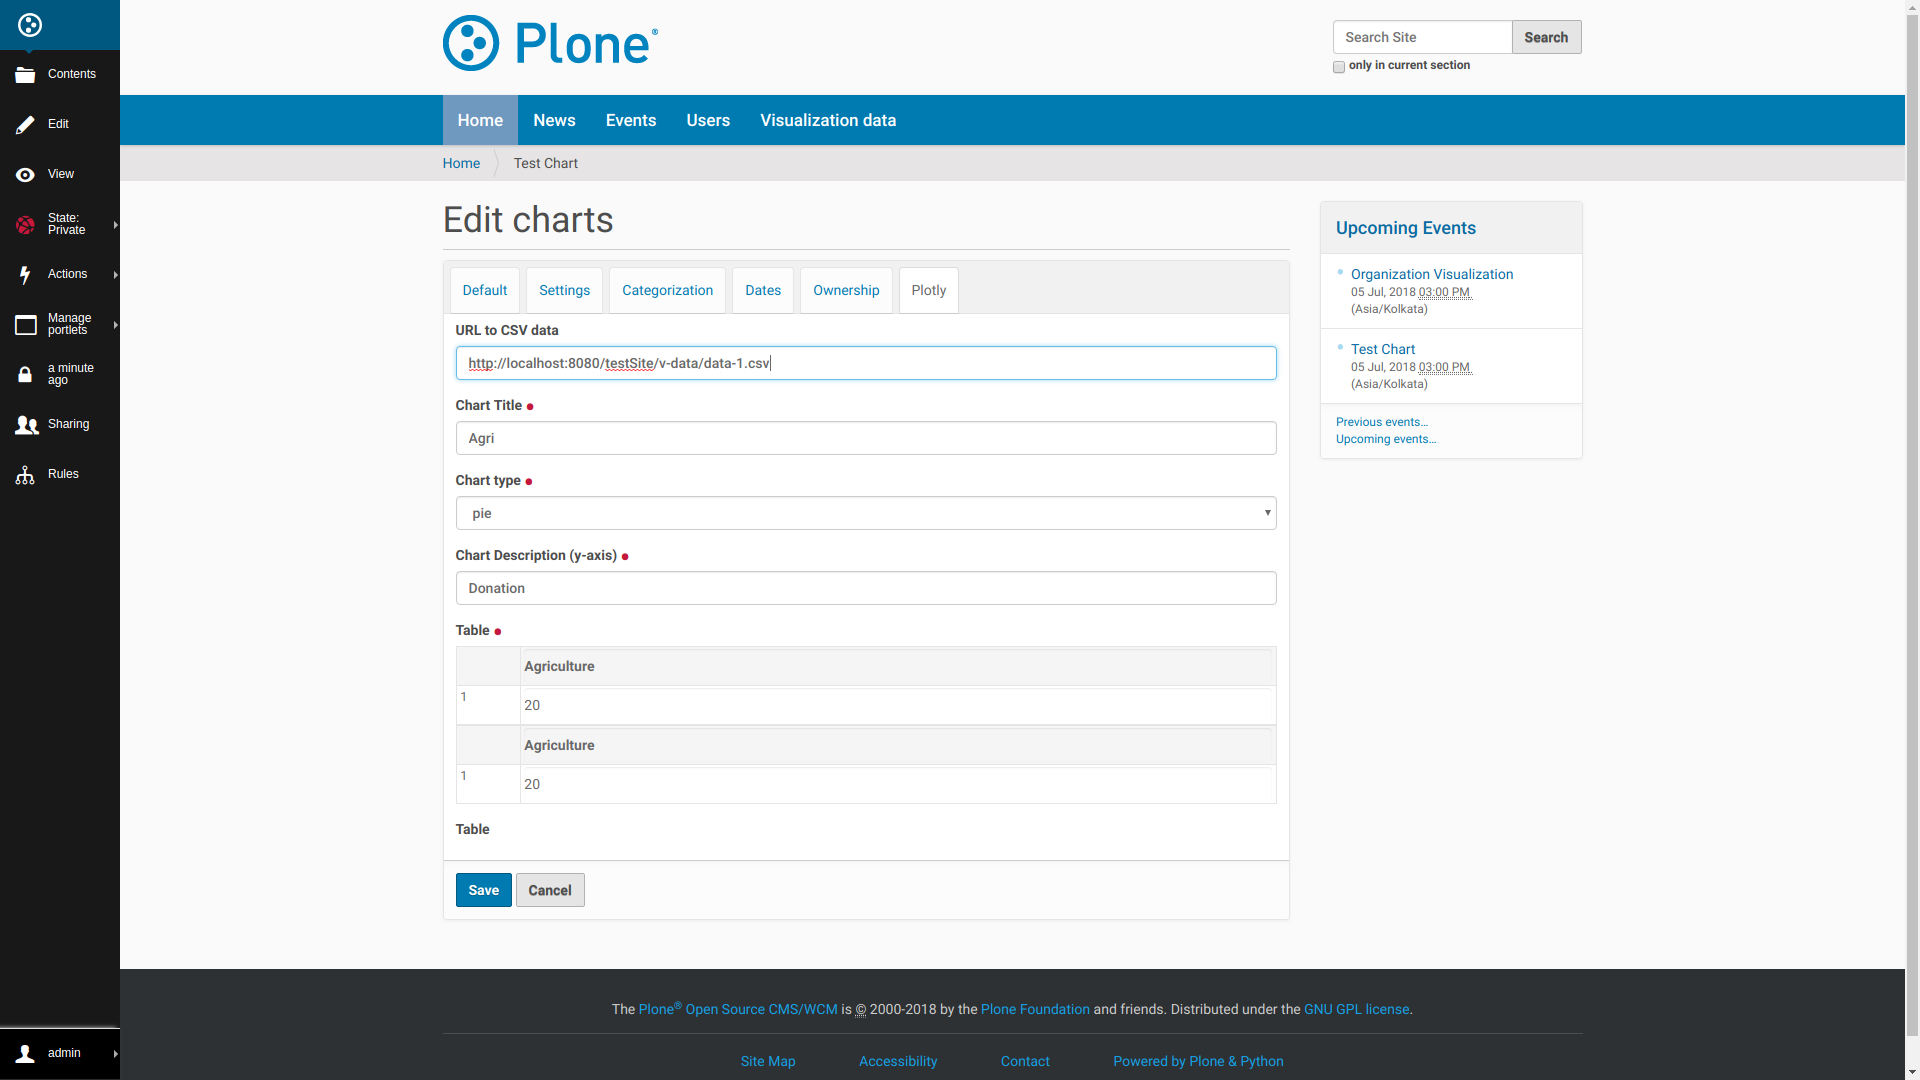
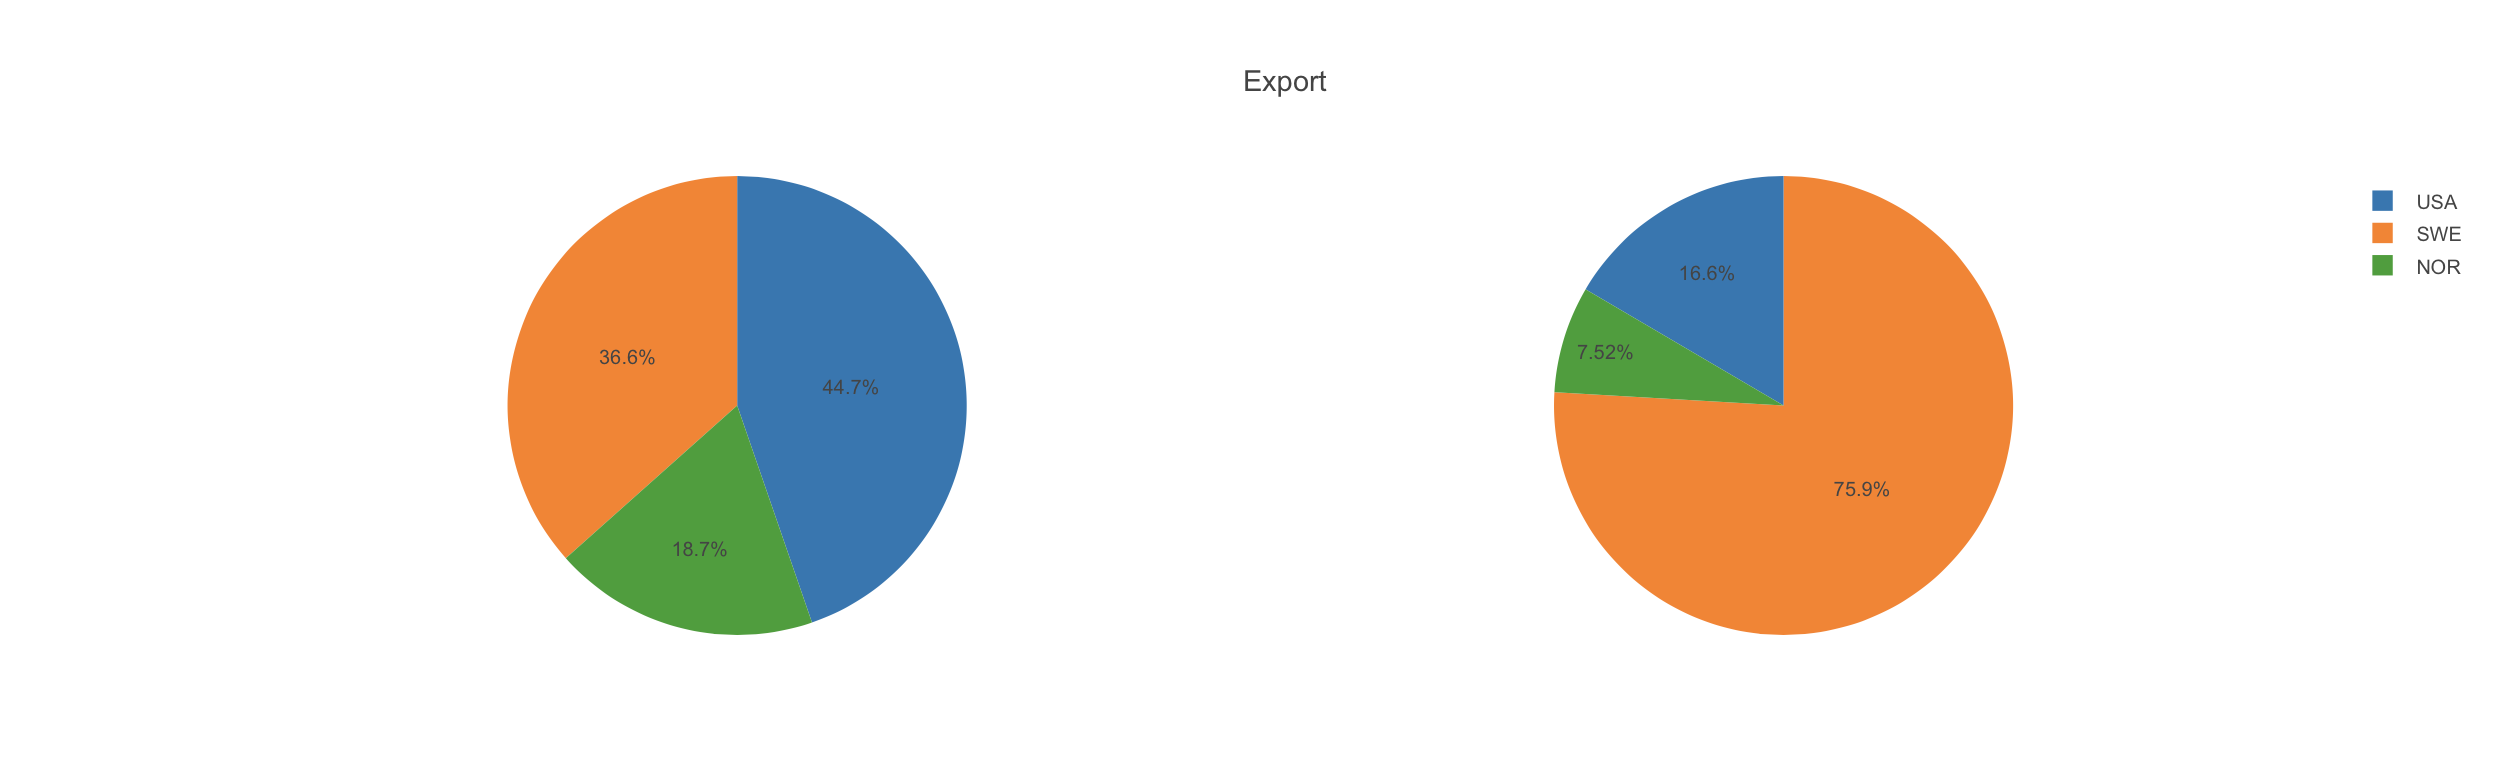
For the pai chart, I think you need to put the values on the other axis (but as said: this package was never finished).
is there any alternative
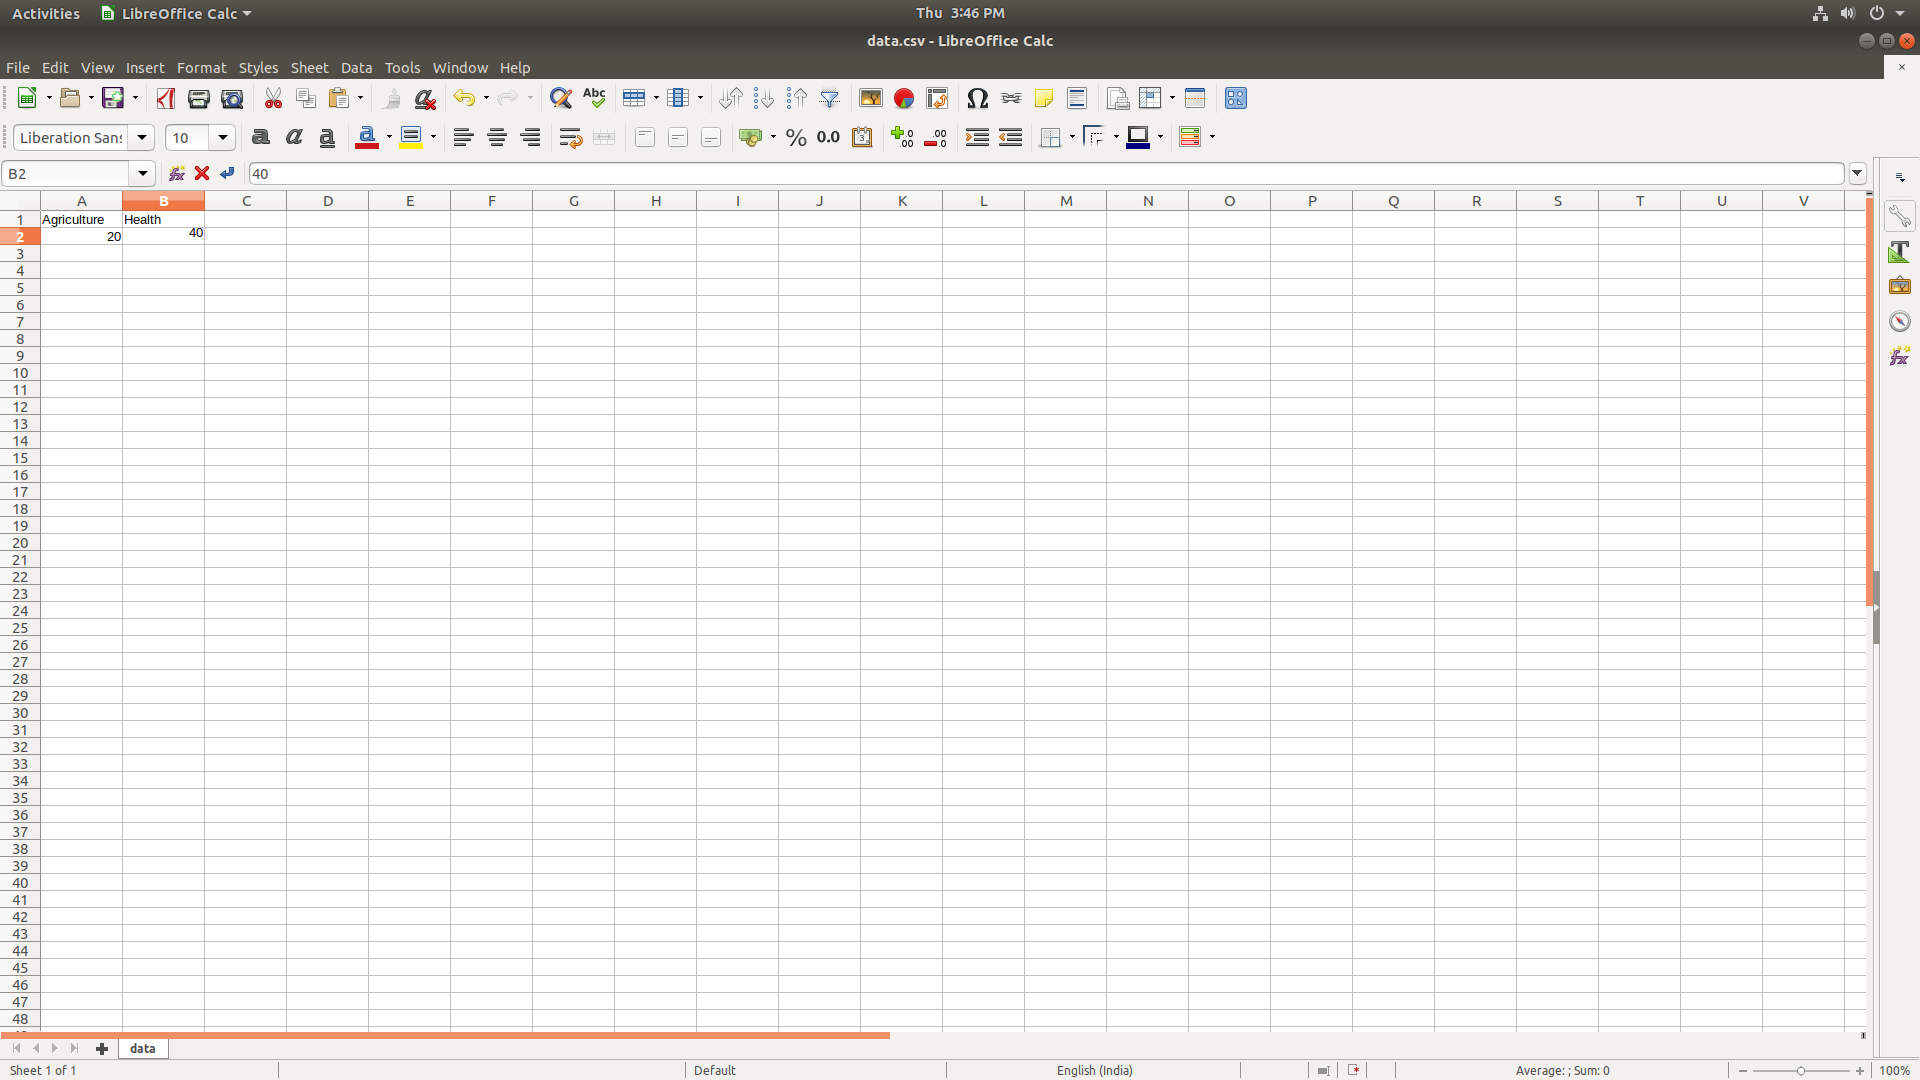
If you want to use plotly with CSV import and your data are in that order in the CSV: No.
You probably have to try:
a) Use another add-on (there might be some 'google-chart' add-ons you could use.
b) Use http://plot.ly and embed the chart
c) Fork the code, fix the problem in the add-on yourself (Should not be too much coding)
c) Sponsor the add-on to get it finished
Sorry bro its not fixed
What is not fixed ?
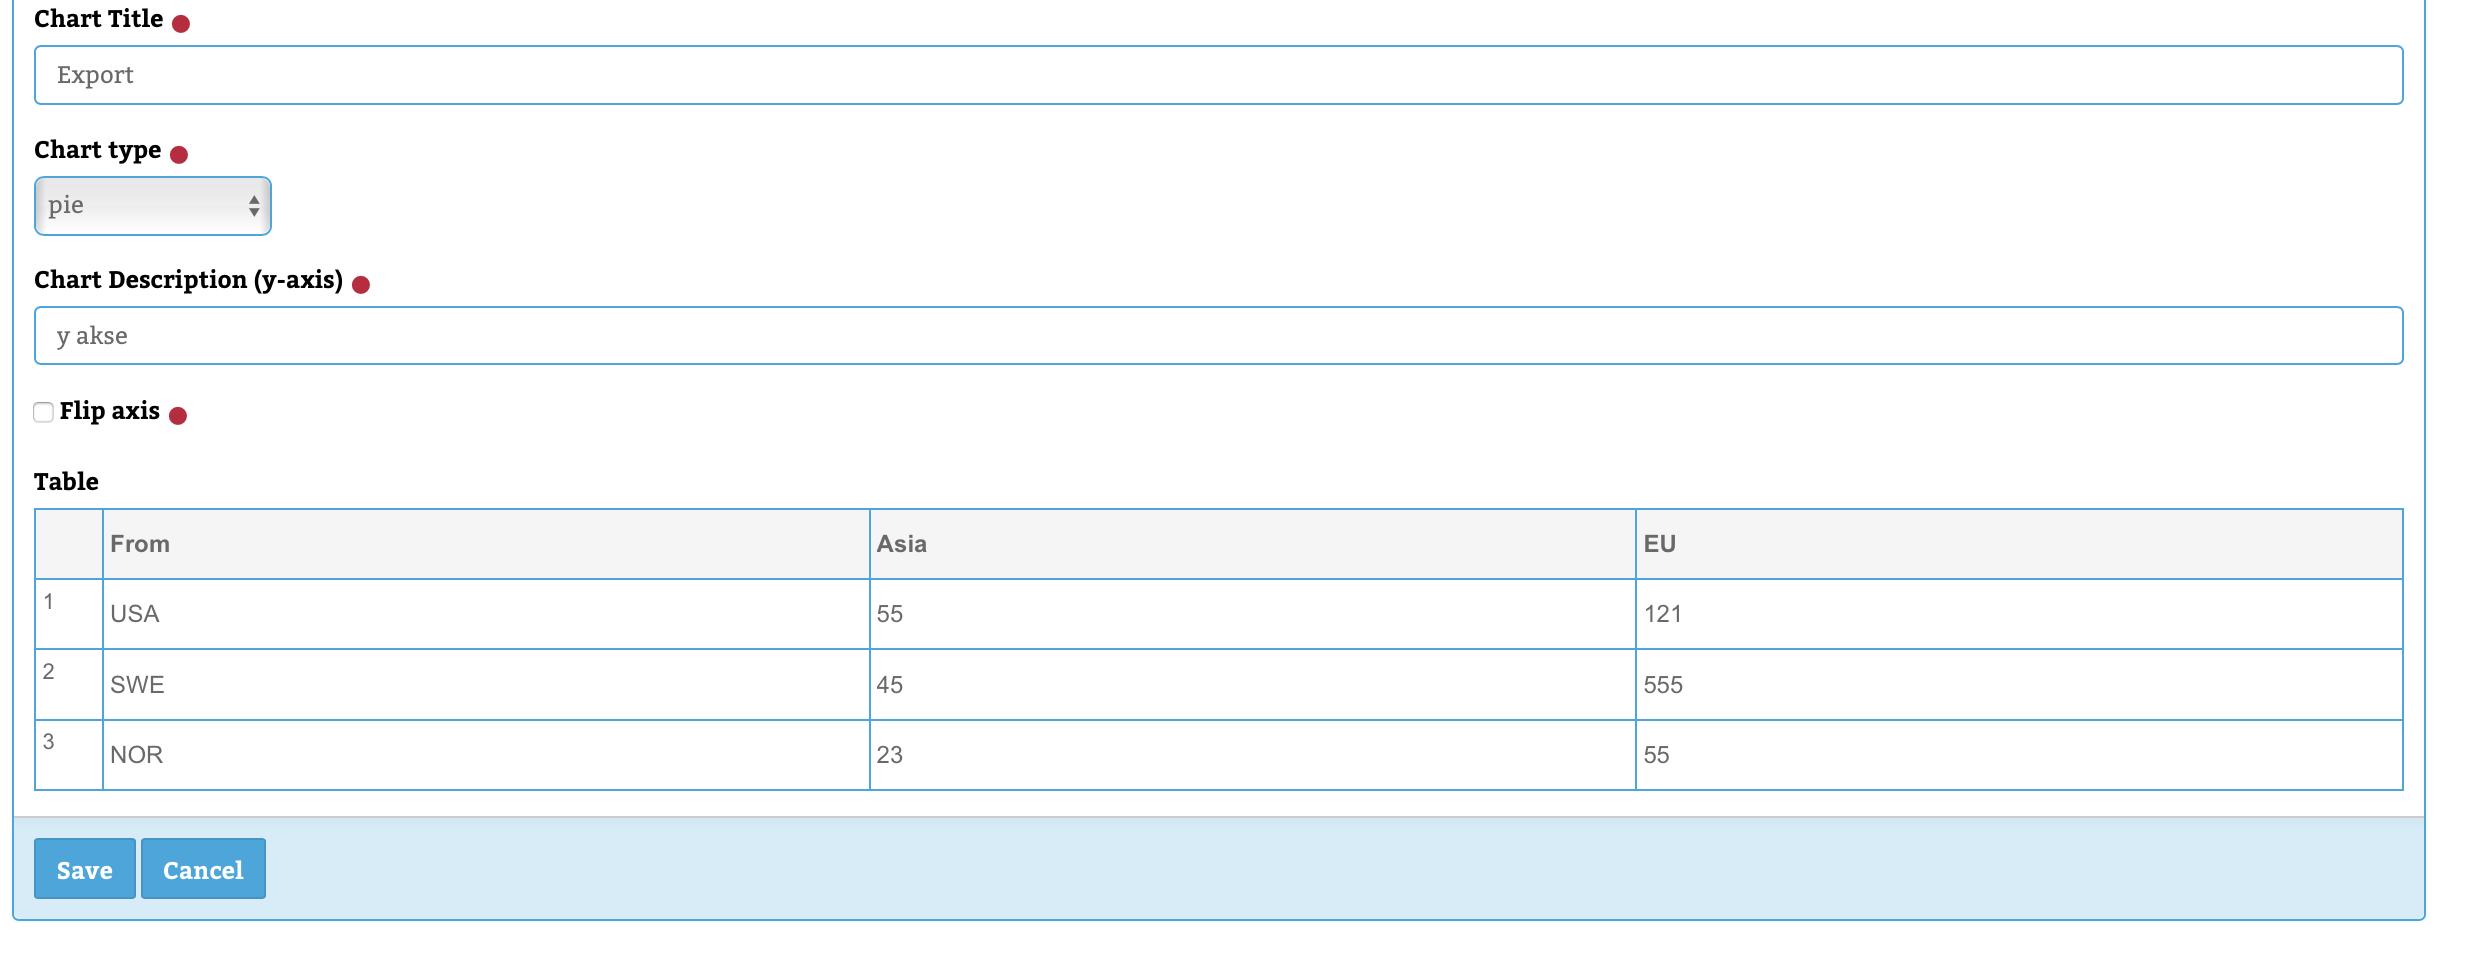
What I meant was that you could add an option to 'flip the axis', so instead of
Option 1 | Some value
Option 2 | Some value
Option 3 | Some value
you flip the axis it in the code (Numpy and Panda has a simple way to do that) , to:
Option 1 | Option 2 | Option 3
Value 1 | Value 2 | Value 3 |